Skip the Rapid Prototype and go straight to the Rapid Fully Functioning Model
It’s a common situation around the globe for financial analysts working for Higher Education institutions. Some type of looming crisis, major project or big decision requires detailed financial analysis… or as has happened here in Australia, the Government now requires universities to report on the full cost of teaching by Field of Education in June each year. The go-to tool for analysts is Microsoft Excel, it’s a great tool, we use it ourselves, and for targeted, specific analysis then nothing else really beats it.
However, things start to get trickier if you want to do detailed analysis on the entire institution, in particular trying to work out the full costs of delivering all of your courses and programs. This requires having a solid grasp of all overhead and in particular, how that overhead should be distributed throughout the institution using a range of different cost drivers.
You have read that Activity-Based Costing is the industry best practice methodology, you’ve done your reading on what’s required and get to work building the rapid prototype in Microsoft Excel. Unfortunately, you hit some problems straight away. The data you requested from HR has 2 million rows and MS Excel can only handle 1,048,576 (to be precise). So you need to decide whether to summarize the data for analysis or use another tool like Microsoft Access, noting that even with Access you need to be careful as each database has a 2GB limit.
Since this is a rapid prototype you decide that summarizing the data is the best option. Then you discover that the department codes in the financial system are different to those used in the student enrolment system, so you need to develop some type of crosswalk.
Then you need to combine all of the financial data, HR payroll data with all of the programs, courses and timetabling data. You quickly realize there is way too much data for excel, so you need to make a decision regarding which ‘short cut’ to make:
a) Start with high level costing at the School / Department level, or
b) Rollup costs outside your primary spreadsheet and start linking multiple spreadsheets together.
You are leaning towards option ‘a’ to save both time and effort, however, as one of your requirements is to answer the Government’s ‘Transparency in Higher Education Expenditure’ submission, you’re stuck with option ‘b’ as you need to know costs down at the course level.
Some things are becoming obvious immediately, simply opening the raw data in MS Excel is taking a good ten seconds and simple processing of the data, like a Vlookup is taking up your coffee break. And you haven’t even got into the detailed allocations yet.
After a good few months of building the Mother of All Spreadsheets you get your first set of results (one of our very first clients literally had a spreadsheet called MOAS! Another had a costing spreadsheet labyrinth with over a million formula embedded in it!). But questions start coming in about how some of these costs were calculated and then suggestions are offered on ways to change these allocations.
You look back at the MOAS and realize that these numerous suggestions are complex and often overlapping. And not only that, the next annual ‘Transparency in Higher Education Expenditure’ submission is now due in a couple of months’ time and it dawns on you – the effort to simply maintain the MOAS is nearly the same level of effort to build it in the first place.
Trying to update MOAS with new courses, new programs, new cost centres and potentially new departments (or even schools!) has made the whole process exponentially more complex and due to the ever increasing size of the model, now needs even more specialist MS Access or SQL Server skills – skills that you just don’t have lying around.
You battle through with the update and manage to get the 2nd model updated with a week to spare, although no real time to analyse the results internally or even benchmark with your peers prior to the submission date.
Then the real kicker occurs – Mathew, the manager that had created and updated the model, suddenly gets a promotion, or worse, leaves your institution. Now you have MOAS, no Mathew, no model documentation, and no back up plan.
This is where we come in with the Executive Model. It is a Rapid Model Implementation solution where we can build the model to cover the entire institution all the way down to individual courses (subjects) and Programs (degrees) in only seven weeks.
How do we do this? We’ve been building very large models for over twenty years, in that time we have developed a number of innovative approaches to handling very large data sets and models so that we can streamline the build, but more importantly the updates as well. We have also spent over a decade building models specifically for Higher Education institutions, so we have a number of standard approaches and rules we use as a starting point, all of which can be further refined by the institution over time.
The Executive Model
A principle aim of the Executive model is to utilise university data to minimise manual intervention in the creation of a cost model. This is achieved through the linking of several disparate data sets:
- General Ledger
- HR Payroll / Establishment FTE data
- Academic Workloads
- Time Tabling
- Student Records
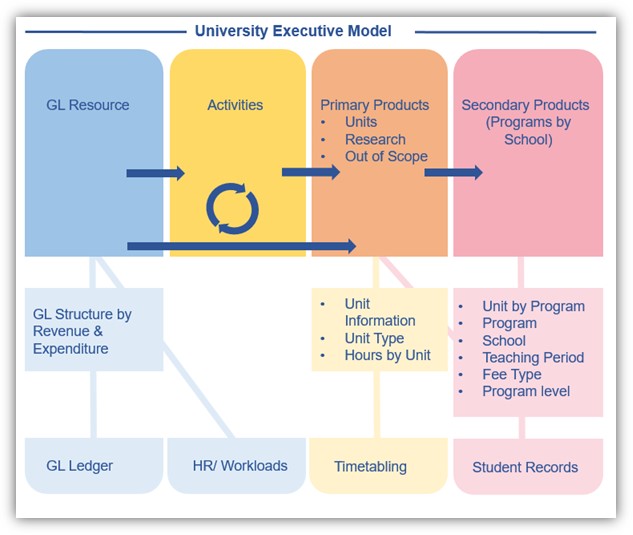
The aim is to build a model that reflects the institution’s business using high level business rules and allocations, whilst at the same time containing enough low level detail to allow the university to further refine activities and allocations over time.
This entire model can be developed in around seven weeks of consulting effort, however this time may be extended based on how long it takes the institution to provide data and review the model. This executive model has been successfully implemented at Australian, US and Canadian Institutions.
So let’s review that model development process again. This time you contact Pilbara Group and we undertake a scoping study based on actual data extracts to determine if your data is complete enough (and of a suitable quality) to support an Executive Model (2 weeks).
Pilbara Group builds your model over the next 5 weeks. We also populate your ‘Transparency in Higher Education Expenditure’ submission for you free of charge AND provide you with benchmarks with a number of your peer universities months before the submission is due, providing you with a massive amount of time to review the model and make any necessary tweaks.
You then discover that because the model calculates the margin at the lowest level of teaching, there’s a number of other uses for the model as detailed in the following blog posts:
- Analysing Workload Profiles at Department Level
- Transparency in HE Expenditure
- Benchmarking
- Understanding Teaching and Research Relationships
- Understanding Teaching Delivery Options
- Identifying courses that are candidates for redesign or elimination
- Identifying programs that are candidates for investment or disinvestment
- Understanding marginal costs
- Price Setting
- Course and Program Relationships
- Improvement of Program Reviews
The following year starts and the next submission is due within 3-4 months of the official start of the academic year. You provide the necessary data to Pilbara Group who update your model within 3-4 weeks. And it doesn’t matter when Mathew announces that he’s leaving – Pilbara Group has all of the model update expertise, the historical model knowledge on business rules and assumptions, and has already written up the model documentation.
You then spend quality data analysis time reviewing and interpreting the results at your leisure.
Life is good.