Important Note: All of the dollar amounts shown below have been changed to protect the data privacy of our client institutions.
Benchmarking within the university sector is not new. It happens at nearly every level – between schools, faculties, peer group universities (private, public, research intensive, regional, etc), and even internationally.
Although this blog is quite Australian-focussed, the ability to benchmark across US Pilbara Group clients is similar and the type of advanced analysis just as applicable.
As a bit of background, a large number of Australian universities are currently going through a Federal Government led data collection exercise “Transparency in Higher Education Expenditure”. More than half of the Australian universities are required to complete this survey in 2018, with more to be included in 2019, and then all universities will need to submit their results in 2020. This is an extension of a previous exercise in 2016 in which just over 40% of universities were required to complete a similar survey.
For those universities without a robust cost model already in place, the effort to populate the survey is extremely onerous as it requires costs to be broken down into a number of categories:
- Academic staff costs (Teaching only)
- Academic staff costs (Teaching & Research)
- Casual academic staff costs (Teaching only)
- Casual academic staff costs (Teaching & Research)
- Non-academic staff costs attributable to teaching and scholarship
- Cost of materials, utilities, equipment
- Expenses that relate to placements
- Depreciation, amortisation, repairs, maintenance, borrowing, bad debts
- Other non-staff expenses
Each one of these categories then needs to be further broken down by the level of education (Sub Bachelor (i.e. Diploma), Bachelor, and Post Graduate course work (i.e. Masters)); and then in turn by 22 Fields of Education (FoEs).[1]
However, for those universities with an existing Pilbara Group model, the data collection effort needed to populate their survey is significantly reduced as the vast majority (if not all) of the data already exists within their cost model. This has enabled Pilbara Group clients to readily access the required data and initiate some preliminary benchmarking amongst themselves. This has provided clients with the ability to see their results compared to a cross representation of other universities (over 20% of all Australian universities) prior to submitting their survey, and more importantly, be able to understand the key drivers behind their results.
As a result of the benchmarking exercise, each client was provided with a customised detailed set of results, covering each of the required 22 FoEs, and each of the three required levels of education (sub bachelor, bachelor, post graduate) as well as Higher Degree Research. It also compared these results to CGS funding rates, and the maximum, minimum, mean and median results of all participating universities.
A number of benchmarks were provided in tabular and graphical form, including (but not limited to):
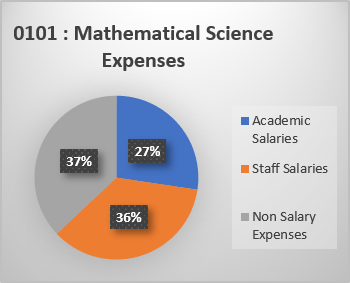
- Cost per EFTSL
- Academic FTE per EFTSL
- Estimated Subject Size
- Delivery Hours / EFTSL
- Academic Salary per EFTSL
- Staff Salary per EFTSL
- Non Salary per EFTSL
- Depreciation per EFTSL
- Placement per EFTSL
To explain how a cost model provides the ability to further analyse the results (beyond cost), one of the 22 Fields of Education is explained in further detail below.
0101: Mathematical Science – Undergraduates
The first field of education on the list, “0101 : Mathematical Science” is a convenient one to analyse. It has a healthy population of students within the undergraduate range at all of the universities surveyed and generally involves a straight forward teaching methodology that doesn’t require specialised equipment, rooms or placements. It covers a range of subjects found in a variety of schools including science, health, computing and business.
“0101 : Mathematical Science” subjects fall into “Band 2”, “Funding Cluster 3”. This generates a total income per CGS[2] EFTSL of $19,328. This is made up of $9,050 in student payments (HECS[3]) and $10,278 in Government contributions.
Base statistics of “0101 : Mathematical Science” across the surveyed universities.
| Undergraduate EFTSL | |
| Max | 830 |
| Min | 250 |
At first glance, there is a surprising difference in the cost per EFTSL across the universities surveyed.
| Bachelor Cost per EFTSL | |
| Max | $ 20,000 |
| Min | $ 12,500 |
This aligns with results of the 2016 survey outlined in Chart i of the Cost of delivery of higher education[4] report published by Deloitte Access Economics on behalf of the Australian Government Department of Education and Training.
A swing of 60% between the lowest cost and the highest cost is of interest and it is worth investigating the root cause of these differences to establish the legitimacy of these numbers.
This is where the Pilbara Group cost model methodology becomes invaluable. The first place to look is the average subject size. How many subjects are being offered across how many locations, delivery modes, and semesters? It takes a lot more effort to teach 100 students in 10 separate subject instances, than it does to teach 100 students in a single subject instance.
| Average Subject Size | |
| Max | 95 |
| Min | 40 |
The maximum and minimum subject size of 95 and 40 students, correspond to the same universities minimum and maximum Cost per EFTSL of $12,500 and $20,000. This provides a clear initial cause of the cost differential. University A is averaging 40 students per subject instance at a cost of $20,000 per EFTSL while University B is averaging 95 students per subject instance at a cost of $12,500 per EFTSL.
University B is achieving its higher than average 95 students per subject in “0101 : Mathematical Science” due to the concentration of these subjects in one school’s core subjects where it has very high enrolments. University B is sitting at a lower than average 40 students per subject instance due to its disbursed teaching load across multiple campuses. It should be noted that even though University B has the lowest average subject size of 40 students in “0101 : Mathematical Science”, 40 is by no means a particularly small or inefficient subject size.
Even within subjects of the same average instance size there can be differing workloads due to individual class sizes (practical/tutorial sizes), delivery (cloud/face to face) and assessment methods. Again, the Pilbara Group model methodology becomes invaluable as it contains significant detail regarding workload and academic effort. In this case, total academic workload covering preparation, classes, assessment, grading, assistance and administration can be accumulated and averaged into a “Delivery Hour per EFTSL” figure.
| Delivery Hours / EFTSL | |
| Max | 45 |
| Min | 20 |
These workload figures once again reflect the same types of ratios seen in the average subject sizes with University B requiring more than twice as many hours of effort per EFTSL compared to University A.
| Cost per EFTSL | Students per Subject Instance | Delivery Hours per EFTSL | |
| University A | $ 12,500 | 95 | 20 |
| University B | $ 20,000 | 40 | 45 |
In summary, a brief examination of the basic, well supported FoE “0101 : Mathematical Science” for the undergraduate cohort has shown a considerable difference in average cost. Delving into the root causes of these differences makes it hard to argue that either figure is wrong, or even good or bad. It should be noted that there is no examination here of quality or results, it is simply an examination of cost. University A is gaining generous efficiencies due to a large centrally based school whilst University B is supporting a geographically disbursed community of students. While University B is achieving this in what looks like a well-managed manner with an average subject instance size of 40, they are still encountering the comparatively larger costs of doing so.
We look forward to analysing this data set in a lot more detail and provide our clients with insights that were previously never possible.
[1] For those readers outside Australia, every subject taught in Australia falls under one of 12 broad 2 digit FoEs, with each FoE then breaking down into 71 4-digit, and then into 357 6-digit FoEs. As an example, 010503 Inorganic Chemistry rolls up into 0105 Chemical Sciences, which in turn rolls up into 01 Natural and Physical Sciences. The Federal Government then partially funds universities based on the number of students taking subjects under FoE, with different funding levels applied to each FoE.
[2] Commonwealth Grant Scheme (CGS) – Through the CGS, the Australian Government subsidizes tuition costs for higher education students
[3] Higher Education Contribution Scheme (HECS) – is a loan scheme for eligible students enrolled in Commonwealth supported places to pay their student contribution amounts.
[4] “Cost of delivery of higher education” Final Report December 2016 – Deloitte Access Economics https://docs.education.gov.au/system/files/doc/other/deloitte_access_economics_-_cost_of_delivery_of_higher_education_-_final_report.pdf, page vii
Would it be possible for you to translate “substance instance” into American English? Is this all the students majoring in a particular discipline (perhaps individuated at the level of FoE)? Or is it all the newly matriculated students in that discipline? It must not be average class size, right? I’m just trying to think through the implications of your examples. Thank you.
Hi Carl,
Sorry for the very late reply, your comment was locked away and not approved and I just found it. Anyway to answer your question, I presume you mean “Subject Instance” this is ‘when, where and how’ each subject/unit is offered. As an example CSC1001: Computer Science – Campus A, Semester 2, Classroom and it will have the number of students actually taking that class, or using Australian terms the EFTSL (Equivalent Full-Time Student Load) noting that one student is spread across multiple subjects/units.
Cheers,
Lea