Thinking in terms of degree and other academic programs is essential when considering your institution’s revenues, costs, and margins. This kind of thinking goes beyond analyses based on faculties, schools, and departments. It is the program portfolio that connects the institution to the student marketplace, so that is the place where resource allocation strategy should logically begin.
Reviewing Your Current Program Portfolio
The most effective time to review your program portfolio is as part of the annual budgeting process. Comparing program sizes, revenues, costs, and margins is an important first step in resource allocation. The comparisons shown below are for an entire institution. (Scrolling up or down the window reveals data for additional programs.) You can narrow the view to show programs only for a particular faculty if that better fits your institution’s style of budgeting.
Programs Offered (Total Cost and Net Margin)

The above includes the effects of overhead on cost and (net) margin. Overhead allocations are important in resource allocation, but sometimes you will want to look only at direct cost and gross margin (refer table below). Comparing the two displays shows that different programs draw different amounts of overhead, which you can analyze in detail through the model’s other reports. In general, the more the overheads vary across programs the more dangerous it is to rely only on direct costs when judging relative profitability.
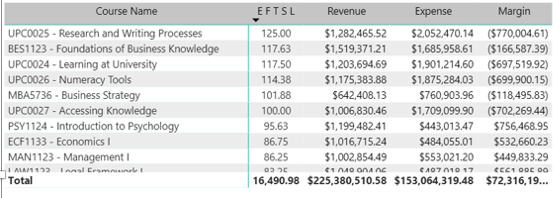
Programs Offered (Direct Cost and Gross Margin)

It’s easy to scan up-and-down the program list to identify the ones that make or lose money. This is not the end of the story, of course. You’ll also want to consider market factors and, importantly, the importance of each program to your academic mission. But knowing the programs’ revenues, costs, and margins will aid immensely in making budget decisions.
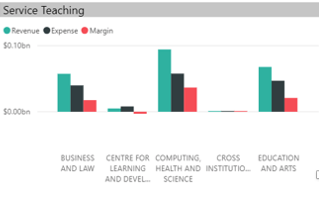
Those decisions also depend upon the ways that program enrollments propagate through to course enrollments. The following table displays the courses taken by students enrolled in a nominated program, with the bar-chart below that summarizes the teaching load by faculty.
Courses Taken by Students for Selected Programs
Summary by Faculty
Narrow the view by clicking on a particular program to get data on the courses taken by its students. This allows you to quickly determine how a program’s enrollment contributes to the revenue, cost, and margin of courses (and the schools and faculties that offer them) inside and outside the major. Sometimes the results can be surprising. In a certain health sciences school, for example, Nursing courses lost money but courses in other schools taken by Nursing students made more than enough to compensate for the loss—a result that could not be known without the mapping of programs to courses.
Effects of Enrollment Change
The Pilbara predictive model, mentioned in Blog 3 “Understanding your Delivery Options”, can be used to analyze the effects of changed enrollment. Plug your new assumptions into the model and get the above results for the new scenario. You will also see how the changes affect class sizes and other operational variables, and so you can consider compensatory changes in staffing and other resourcing levels. The model takes account of any excess capacity in classes, and if properly configured it differentiates between variable and fixed overhead.
Cost Reduction
The mapping of programs to courses allows you to find opportunities for cost reduction, should that prove necessary. One way is to identify candidates for redesign or elimination (as discussed in Blog 4 “Identify Course Candidates for Redesign or Elimination”) from among the courses that contribute most heavily to the program’s overall cost. Another is to look at the course-taking behavior of students, and perhaps to the curriculum itself. It’s common for the list of elective courses to grow over the years, to a point that makes neither educational nor economic sense. Pruning the list or nudging the students in other ways may reduce the number of small-enrollment courses both inside and outside the major, with attendant efficiency and perhaps educational benefits. More significant curricular changes might concentrate enrollment in fewer, more optimally-sized courses. Thinking further outside the box, the cross-program sharing of more courses might move the institution or faculty toward creating a more coherent program portfolio. These moves will require strong academic staff participation. But regardless of the process or outcome, the first step is to get a clearer picture of how programs map into courses and conversely.
Download the full whitepaper here: www.pilbara.co/whitepaper