Higher Education
You Focus on Academic Leadership, Planning and Student Enrichment
and Let Us Focus on Data
Say Goodbye to Spreadsheets, Hello to Efficiency!
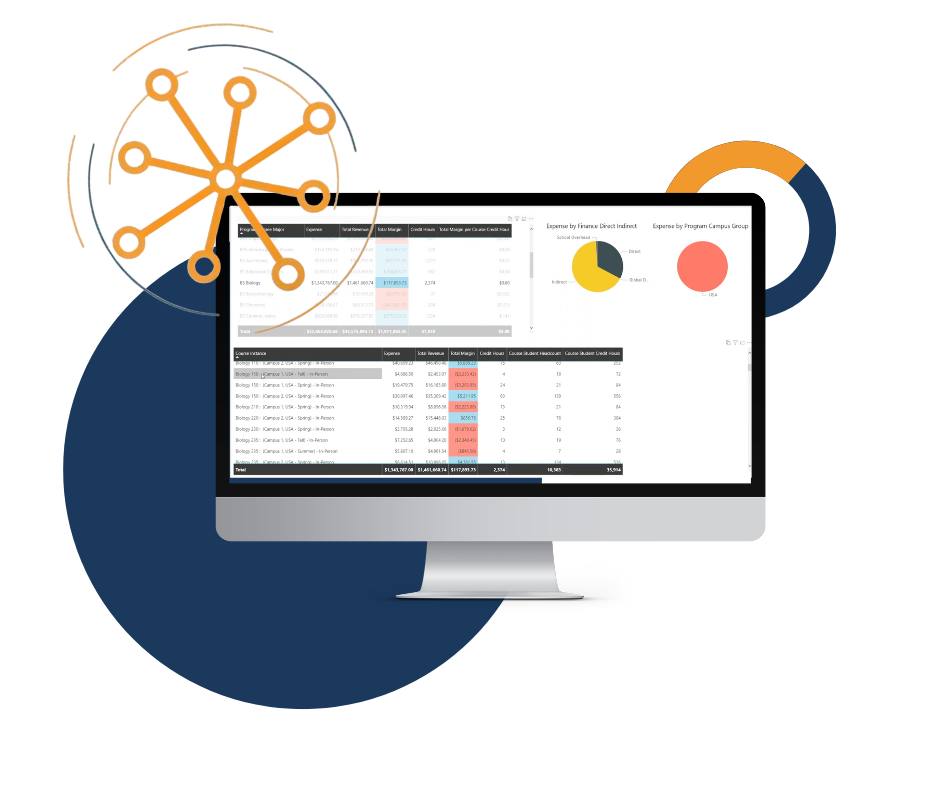
Unlike spreadsheets, the Pilbara Insights advanced modeling platform will centralize, systemize and standardize the calculation of financial performance; including all academic programs and associated courses, so you can optimize the program and student mix to maximize margins for the entire institution.
Providing you with all the data on revenue, expenses and margins for all programs in the entire institution (plus all associated courses) allowing you to perform analysis to optimize these programs to maximize margins while staying true to your mission.
Are you inundated with ad-hoc program and course financial report requests? Save significant time with a pre-built centralized, standardized and systemized model of your entire institution with all the data you need to run rapid reports in minutes not days or weeks!
Best performing financial teams spend more time on analysis and less time on data gathering. Let us do the data gathering, cleansing and modeling for you.
Ready to Streamline Your Academic Program Review?
See all of your Revenues, Costs and Margins for every Program and Course across your entire institution!
- Financial Data
- Student Data
- Financial Data
- Student Data
- HR Data
- Timetable Data
- Financial Data
- Student Data
- HR Data
- Timetable Data
- Facility Data
- Executive, or
- Strategic Models
- CO2 Equivalent data (Electricity / Natural Gas)
- Water
- General Waste
- Recycling
- Carbon Offsets
(time to implement)

Days
Weeks
Months
Custom
Custom
Our solutions are scalable and adaptable, empowering you to stay ahead of the curve and respond to changing market dynamics. Models that grow with your needs.
- Rapid Insights – Low-cost, low-risk entry into ABC models.
- Executive Insights – taking the Rapid model one step further by introducing more detail with HR/Payroll data.
- Strategic Insights – expanding on the Executive model with the inclusion of Facilities data and Research data, if available.
- Predictive Insights – using previously built Executive or Strategic Models, the Predictive model can be used to forecast a range of different scenarios, including things like calculating the costs required to support increases in student numbers (by different types of students) or the introduction of new programs or removal of old programs. This can be done for a one year forecast or up to a ten years forecast, taking into consideration things like inflation estimates and enterprise bargaining arrangements.
- Environmental Insights – Carbon Accounting models can be built using either an Executive, Strategic or Predictive Model, environmental metrics can be included as an extra “cost” component to resources, i.e. Carbon Dioxide Equivalent metrics, required for calculating the institutions overall carbon footprint, but more importantly being able to calculate the carbon footprint on a per Program basis or on a per “activity” or school basis so that the institution can measure the footprint but also to manage this footprint. The major benefit of this type of Carbon Accounting is that it includes all financial cost as well, so you can look for the most cost effective way to reduce your carbon footprint at a granular level.
Rapid Insights Example Reports
Click on the interactive report below. Please use the bottom navigation arrows to move through pages and enter fullscreen mode.
- Page 1 – P&L View – You can click on a particular School/College at the top and the report will provide data for only that school.
- Page 2 – Revenue, Cost and Margin by School/Department – You can right mouse click on a college/school and drill into all underlying departments.
- Page 3 – Program and Course Relationship – You can see detailed financial metrics and Student Credit Hour for every Program and Course in the institution. Clicking on the College/School menu at the top will filter the data for that particular College/School. Clicking on a Program will show all associated courses and vice-versa, clicking on a course will show all Programs that course is taken in.
- Page 4 – Program Financials per SCH – Highlights the Revenue, Expense and Margin per Student Credit Hour for each Program Major. Clicking on the College/School menu with filter the results to that particular school.
Our Clients Use Activity-Based Models to Make Smart Financial Decisions

Request a Demo
Discover the power of Pilbara Insights and take control of your organization’s financial future. Request a demo or contact our expert team to learn how our Activity-Based Cost Modeling engine can optimize your costs, drive sustainable growth, and boost profitability. Don’t let inefficiencies hold you back—start optimizing your costs today!


