Stagflation: An economic situation in which prices keep rising but economic activity does not increase (Cambridge Dictionary)
TLDR
- High Inflation hasn’t been around since the 70’s and 80’s.
- During periods of high inflation focus on defending margins and cashflow.
- This requires sophisticated and detailed Activity-Based Cost models (which were prolific in the 80’s and 90’s).
- Activity-Based Cost models have improved significantly since the 80’s and 90’s.
- Use Predictive Cost models to forecast various scenarios – For Higher Ed this includes changes in student numbers, class sizes and forecasted inflation rates up to 10 years into the future.
In the June 11th-17th, 2022 issue of The Economist, the article “No Margin for Error – A guide to running a company in a period of stagflation” highlights the fact that a lot of US CEOs currently running companies had not even started university in 1979 when Paul Volker, inflations enemy-in-chief, became chairman of the Federal Reserve. Their tenure was a wonderful period of low inflation and high profits, even during the Global Financial Crisis and the Pandemic. However, this is changing rapidly, inflation is increasing and is likely to stay high for at least several years, the World Bank has warned that “several years of above-average inflation and below-average growth now seem likely.” The last time this happened in the US, it lasted from 1979 to 1986. According to the Australian Bureau of Statistics, the high inflation period lasted from 1973 to 1990 (17 Years!!!) and there is no guarantee that this time will be any different, or indeed worse. The high inflation period in Australia covered my primary school, high school and early university days and I can distinctly remember my parents desperately trying to keep making mortgage payments on 17% or 18% interest rates (I actually think it was higher sometimes) and keep all six of us fed on a builder’s salary. It was actually worse because my father was a subcontractor so income was on a job-to-job basis, and if a building company went bankrupt, then we got nothing! So I have huge amounts of empathy for Australian “subbies” struggling right now with one building company collapse after another.
So long story short – it’s going to be tough and it’s going to be tough for many years to come!
Although the Economist article is focused on For-Profit companies, it is absolutely relevant for Higher Education management, because, unfortunately Higher Ed is not immune to inflation.
So what to do about it?
According to the Economist article, today’s executives may think they are battle-hardened after the Global Financial Crisis and the Pandemic, but tackling stagflation requires a different toolkit, that borrows from the past and also involves new tricks.
Defend Margins and Cashflow
“The primary task for any management team is to defend margins and cashflow, which investors favour over revenue growth when things get dicey.” In practice this means a combination of cutting expenses and passing cost inflation on to customers without dampening sales volumes.
Cost-cutting will be a real challenge, but I would argue that what is really required is cost management, or to look at it in a slightly different way, resource management. This is where we get back to the basics of Activity-Based Costing (ABC). ABC really took off during the previous high inflation period, because organizations had to take a more nuanced look at all of their costs and how those costs contributed to revenue generation. As inflation dropped and the economy picked up, there was no real need to get into detailed cost analysis, as long as revenue was a lot higher than cost, then all was good. ABC still provides significant benefit to organizations, even when business is great, but back then maintaining ABC models was time intensive and expensive, so a lot of models were dumped. Things are different now!
Activity-Based Costing and Stagflation Management
I refer to this as Activity-Based Costing, but as mentioned previously it is really about identifying all resources and how they are being used inside the organization. Resources include people, facilities, equipment, cash etc. Each resource can be traced to the outputs of the organization, whether that is by contributing directly to the development of a product for sale, or a service, or in the case of Higher Education, a course being taught. Or by contributing indirectly as an overhead via support services like administration, payroll, IT Services etc.
Each resource will have a cost associated with it, either a financial cost, environmental cost or social cost, for this blog post I’m just going to focus on financial costs. If you are interested in learning about how to include environmental costs then here is blog post on the subject https://www.pilbaragroup.com/combat-climate-change-cost-carbon-accounting/.
Tracing each resource through the activities (Jobs done) to the final product or service is exactly what ABC models are. If you then include the revenue generated by the products or services sold then you can easily calculate margins on individual products/services or per customer or per channel.
This provides tremendous insight into the inner workings of the organization and the engine that creates margins.
The next step is to “tune” this engine so that it runs as efficiently and as smoothly as possible.
The number one thing companies (and Higher Ed) do during a financial crisis is reduce staff numbers, we saw it first-hand during the pandemic and, yes, sometimes it is unavoidable. Payroll is usually the biggest expense, so it works as a short-term solution, but what about in the longer term, is there a more strategic option available?
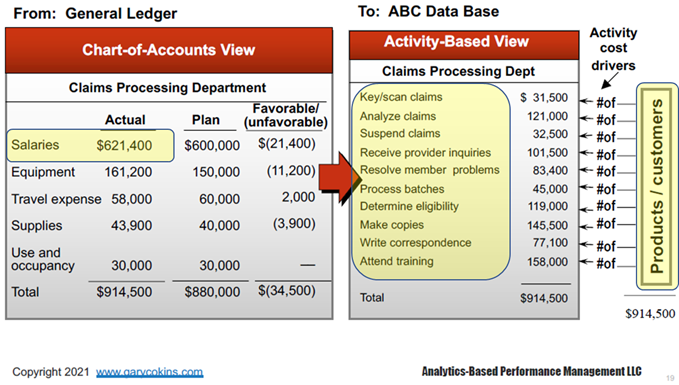
Now that we understand the fully-burdened margin (including all direct and overhead costs) on individual products and services, we can now look to increase these margins without necessarily increasing price. The economist article actually states that it is inevitable, that during this period of stagflation that price increases will have to be passed onto customers, they state “In the current climate, though, hard-headed (and hard-hearted) cost control won’t be enough to maintain profitability. The remaining cost inflation must be pushed through to customers.” This is where I’m going to disagree slightly with the article. There could be ways of maintaining margins without increasing prices, if we know the inner workings of the margin engine and traditional accounting doesn’t provide this insight. Traditional accounting focuses on what is SPENT, whereas ABC focuses on how resources are USED. In the example below, traditional financial accounting will report salaries but not what those people do, tracing those people, through their jobs, to the products/services they support is the job of ABC. How this can be used to defend margins without necessarily passing on price increases is discussed in the practical example later in the article. I should state that I’m also a pragmatist, so cost cutting and price increases may have to be done, but it should be done in a considered and detailed way, rather than broadly across the entire organization.
ABC 2.0
As mentioned previously building and maintaining ABC models was manually intensive and expensive. This is no longer the case, these models have been refined and automated over time to use as much source data as possible, developed using approximate allocations rather than precise allocations and developed using standards. For our Higher Education models we have standard data templates, standard drivers and standard reports and our models can be built in days now, rather than months or years as was the case back in the 1990s. This is also a starting point for model development, we have discovered over the decades that it is much better to get a standard, simple model developed quickly and then layer in complexity over time, rather than starting with a blank piece of paper and lots of interviews and meetings!
Practical Example
Let’s take a look at a couple of practical examples of ABC models being used to manage margins. These examples can be run in either our Executive Insights or Strategic Insights models.
To start with, we want to look at the entire institution, including all overhead and direct costs. Using the ABC model we can assign all costs to all individual subjects, so this provides the fully-burdened cost to deliver that subject. Then by associating revenue with that subject, we can determine the margin for every subject taught.
By including the number of students taking each subject, we can start to get a picture of margin compared with demand and we can break this up into four quadrants as shown below:
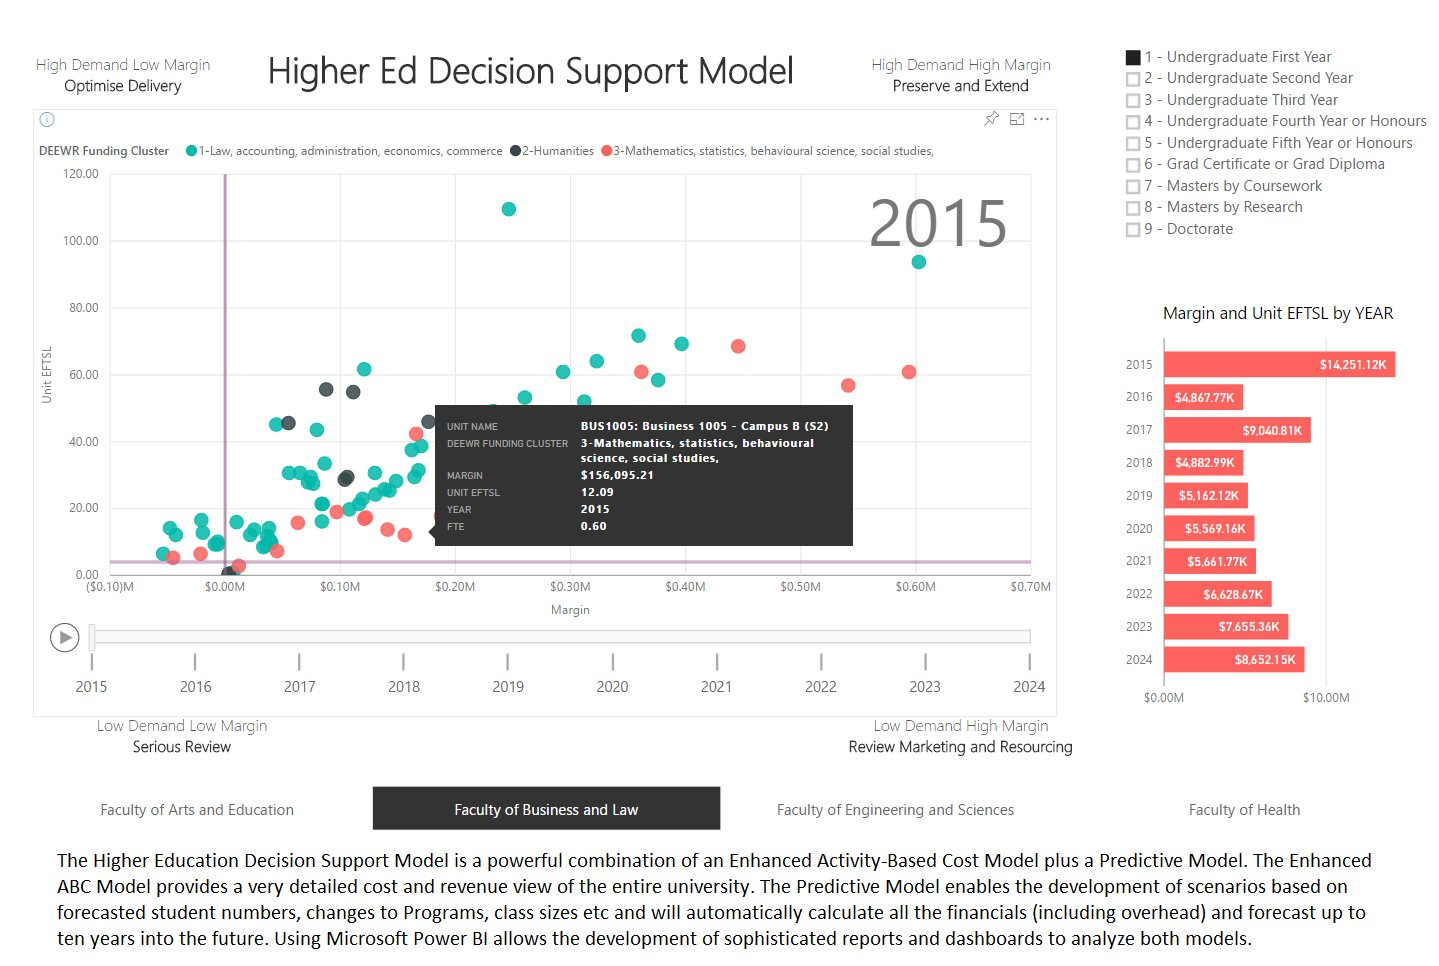
Each quadrant has it’s own associated strategy:
- High Demand / High Margin – Preserve these and grow them!
- High Demand / Low Margin – Optimize Delivery – Is there a more efficient way of delivering these subjects?
- Low Demand / High Margin – Review Marketing and Resourcing – Is there a way of getting more students taking these subjects?
- Low Demand / Low Margin – Serious Review – Should these be kept? If they are core to the mission, then yes they do, but how do you subsidize them?
The objective is to perform this granular analysis to see if there is a way of increasing margin without having to cut cost.
Break-Even Analysis
For all of the low demand subjects, we can perform a more detailed break-even analysis on these, but we have to be careful, because removing low enrolment subjects may actually put the institution into a worse financial position, as we’ll explore now.
The big question when examining low enrolment subjects, is how low is low! Some low enrolment subjects could still be making a positive margin. So how do we calculate a break-even point for these subjects?
This is where we have to get quite detailed cost information, we need four components of cost:
- Fixed
- Variable
- Direct
- Overhead
This analysis shouldn’t be done on an ad-hoc basis (although most institutions currently do that), it should be conducted on one central, standardized model of the entire organization so that each school under investigation is being considered using the exact same method of calculating all of these individual components of cost.
Let’s take a look at some data from this worked example:
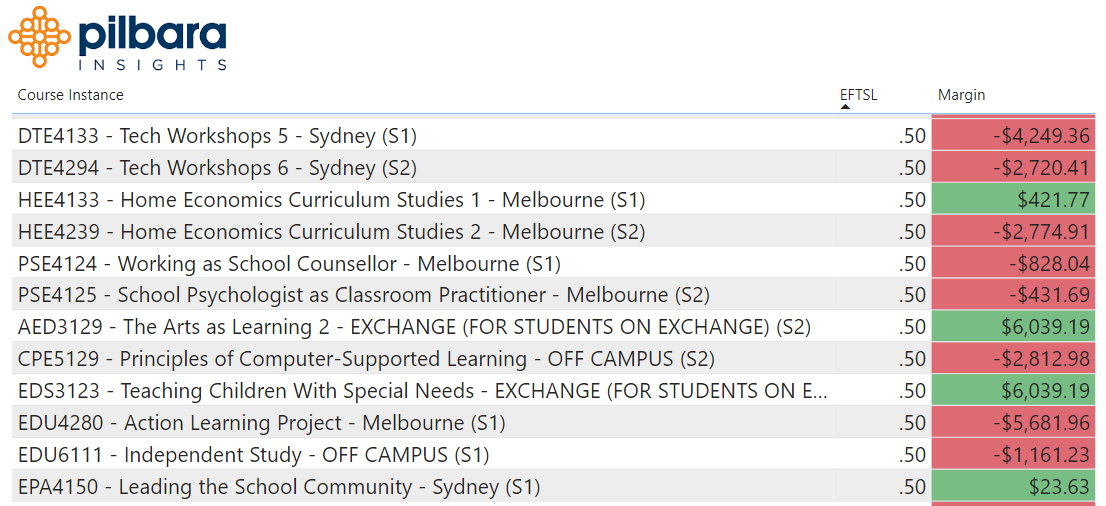
In the worked example, we are analyzing all subjects taught in the fictitious School of Education, as mentioned previously, some of the low enrolment subjects are making a small positive margin as shown below. The term EFTSL stands for Equivalent Full-Time Student Load.
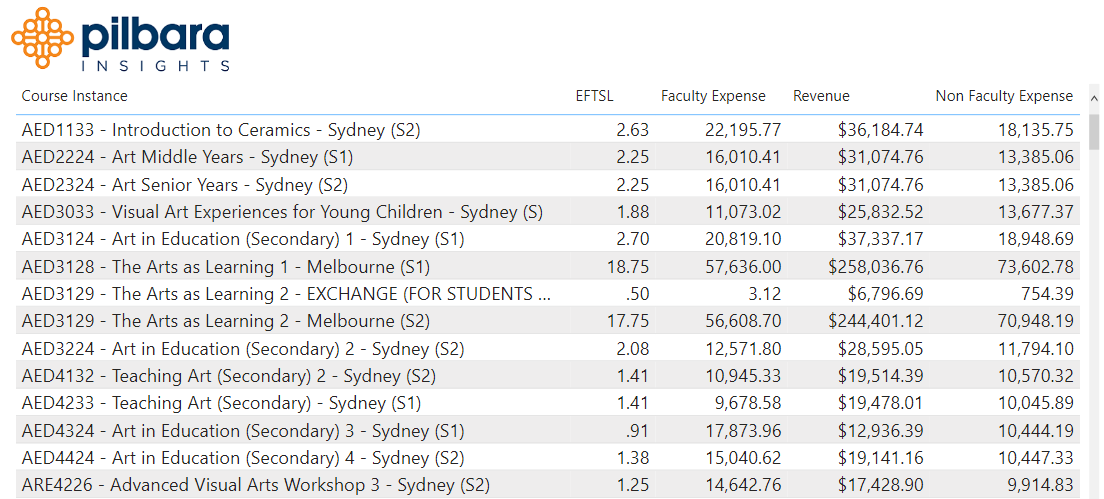
We can now break the margin up into it’s cost and revenue components and further break cost up into it’s direct and overhead components. In the table below “Faculty Expense” is direct cost and “Non-Faculty Expense” is overhead.
Taking this data we can plot it in Microsoft Excel to provide the following scatter plot with associated trend lines and formulas:
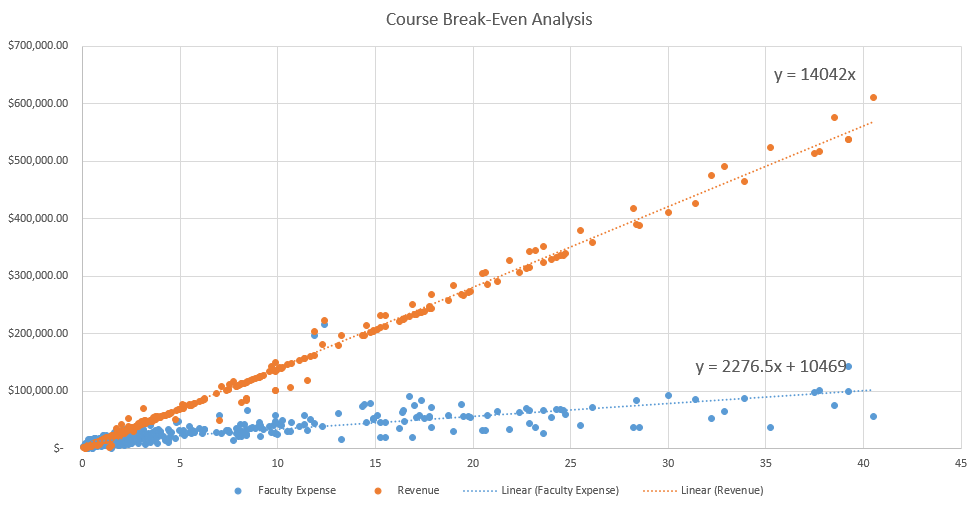
This chart provides us with the fixed and variable components of cost and revenue on a Per EFTSL basis, that is:
Revenue (The Orange line) – Variable Revenue of $14,042 per EFTSL
Direct Expense (The Blue line) – Variable Cost of $2,276.50 per EFTSL and a Fixed Cost of $10,469
We can then easily calculate the break-even point, where the revenue line and the direct cost line intersect, in this case it is 0.89 EFTSL (or approximately 7 students).
By factoring in overhead we can recalculate the break-even point, in this case is 1.47 EFTSL (or approximately 12 students).
So, what does this mean? Any course with less than 7 students should be seriously reviewed because they aren’t even covering their direct costs.
But courses with between 7 and 12 students are covering their direct cost AND contributing towards the overhead expenses.
This is really important to understand because if you remove the courses between 7 and 12 students then you may save on your direct cost, but the fixed overhead remains the same and is simply redistributed over fewer subjects (causing each of them to individually need more EFTSL to break-even) – the end result could be that you lose more revenue than you save in expenses!
The important thing to remember is that a subject that appears to be losing money can still be covering its direct costs and contributing towards some of the overheads (just not all of them). Removing these subjects without fully understanding their contribution to the overall school bottom line could actually lead to a worse financial position!
Forecast Future Scenarios with Predictive Models
The analysis above is focused on the institution as it currently operates. What’s really needed is the ability to create a range of different scenarios over multiple future years and see what the financial impact is on the institution. Doing this in advance allows the institution to carefully prepare a number of contingency plans in advance, rather than rush through plans in a hurry right in the middle of a crisis.
With the Predictive Insights model, analysts can adjust things like:
- Student Numbers – The forecasted number of students in individual programs, and the different types of students (Domestic, International, In-State, Out-of-State etc.)
- Class Sizes – This one is a bit tricky because the size of the class could have an impact on the quality of learning. Working out an optimal size could be done over time by including quality metrics in the model and comparing various class sizes to education outcomes.
- Inflation – No one knows what the inflation rate is going to be by the end of the year, let alone ten years from now. But the model can be used to run a number of different scenarios, including some with outrageous numbers just to see what could happen. What happens if we return to the same level of high inflation of the 80’s and 90’s in only five years?
Here is another blog post that goes into a bit more detail on using the Predictive Insights model: Higher Education Financial Stress Test
With detailed knowledge of the granular costs of your institution it is possible to weather this high inflation storm and focus on defending margins and cashflow over the next few years, while also ensuring that you stick to your mission. Higher Education is a different beast to the For-Profit organizations discussed in The Economist article, you can’t simply cut products (programs/subjects) that aren’t profitable, particularly if they are core to your mission. This means it is even more important to have this detailed knowledge of your costs and margins, so you can determine how to subsidize those loss making programs or subjects and ensure you defend your margins overall!