We are proud to announce the launch of our new modelling solution, Rapid Insights. We developed Rapid Insights as a low risk, low cost entry into advanced financial analytics for Higher Education. The objective is to build a model of the entire institution in only days, rather than months or years. The exact number of days required depends on the data quality and receiving this data in a timely fashion.
What can you do with this model?
There is a wide-range of analysis that can be performed after the model is built, we use a “build once, use many” philosophy, but there are a few popular uses of the model:
- Program Review – 86% of universities using our models flagged program evaluation/optimization as the primary reason for initially building the cost model. Compared to ad-hoc spreadsheet analysis, which may focus on just one program or a single school, our model is built to contain every program and course in every school/campus. So once it is built, program review can occur immediately for any program in any school across the entire institution.
- Revenue allocation – Particularly important if all revenue is received centrally, finding a way of allocating revenue to individual subjects/programs is important for margin analysis and tuition setting.
- Overhead allocation – Overhead is growing and can easily be over 50% of all costs for Higher Ed, there are many contributing factors to this increase and has lead to a lot of spirited debate in online forums. Rather than get into the argument about why overhead is so high, we’ll focus on how it impacts the overall financial performance of an institution. Allocating overhead by only using a simple “Student Credit Hours” metric can overestimate the cost of large classes and underestimate the cost of small classes, which will lead to incorrect strategic decisions being made. To get a more accurate picture, our models will use a wide-range of allocation methods based on “cause and effect” logic. Also by making overhead transparent, this can lead to internal spirited debate on how best to manage and/or reduce overhead.
This whitepaper co-authored with Professor Bill Massy (Stanford University) provides more detail on the various ways the models are currently used by institutions.
Why did we develop a Rapid Model?
We love building models, we’ve been doing it for over 20 years now. We have built some massive models for military organizations in Australian and the US, oil/gas companies and Higher Education. One of our university models has over 190 million different allocation paths, try building that in Excel! We love digging into the models and improving them over time so they can become quite detailed, but also quite complex.
We have listened carefully to owners of the models inside universities and one of the problems they face is getting key stakeholders involved with the project but also using the models.
If the model is too complex, key-stakeholders have difficulty understanding the model.
If they don’t understand it, they don’t trust it.
If they don’t trust it, they don’t use it.
So we developed a simpler, rapid model to enable key stakeholders to get onboard right at the beginning of the analytics journey, to make it easier to understand and allow them to make valuable contributions to future model changes.
Once the base Rapid Model is completed, then complexity can be layered on overtime, but more importantly taking all users of the models and key stakeholders on the journey together with everyone contributing to these changes.
It’s important to note that the Rapid Model is simply the STARTING point. This whole approach is similar to the “Lean” approach – develop something rapidly, get feedback and improve the product. The alternative, and this is particularly true for these types of models, is to agonize over the detailed specifications of the model, take many months and many meetings to finalize the specification before even starting the build. The build can then easily take many more months (or we have seen years as well) to develop and then find that no one uses it because it’s too complex, or it doesn’t provide the specific output or reports required.
How can we build the model so quickly?
- We have built hundreds of different models across multiple different industries over the last 20+ years, but more importantly, we have been focused on Higher Education models for over a decade now.
- We know how these models are used, so we know what the end state needs to be.
- We know exactly what data is required to get to this end-state.
- We know the top allocation methods/rules used by all universities.
- Our modelling engine “Pilbara Insights” has powerful capabilities to greatly simplify the modelling process. Some examples are that it allows ways of automating as much of the manual allocation process as possible and also automatically resolves those very tricky-to-model-in-excel overhead to overhead allocations, i.e. how do you calculate the costs of HR supporting IT and IT supporting HR, known in the modelling world as “circular allocations”.
What is the process to build the rapid model?
Step 1 – We provide you with an Excel template that you populate with data from your financial and student management systems as well as your current organization structure. We will provide example data so it’s easy to follow and populate.
Step 2 – This data is then processed through our standard data cleansing, preparation and loading process.
Step 3 – The model is then “balanced” – making sure that all cost and revenue data that enters the model is allocated to all outputs from the model.
Step 4 – Standard reporting databases are built.
Step 5 – Standard Microsoft Power BI reports are built.
Step 6 – The initial results are presented to your team and key stakeholders.
Step 7 – Access is provided to these reports to your team and key stakeholders, depending on the number of licenses purchased.
Step 8 – We will then provide guidance and advice on next steps and how the model can be enhanced.
The Journey
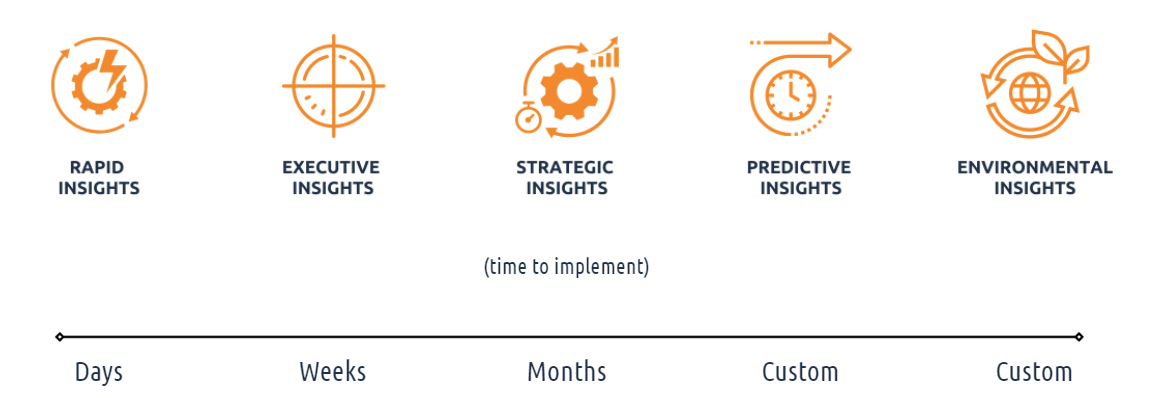
As mentioned earlier, this is the beginning of the analytical journey, we have a number of standard model solutions that the Rapid Model can easily evolve into, namely:
- Executive Insights – taking the Rapid model one step further by introducing more detail with HR/Payroll data.
- Strategic Insights – expanding on the Executive model with the inclusion of Facilities data and Research data, if available.
- Predictive Insights – using previously built Executive or Strategic Models, the Predictive model can be used to forecast a range of different scenarios, including things like calculating the costs required to support increases in student numbers (by different types of students) or the introduction of new programs or removal of old programs. This can be done for a one year forecast or up to a ten years forecast, taking into consideration things like inflation estimates and enterprise bargaining arrangements.
- Environmental Insights – Carbon Accounting models can be built using either an Executive, Strategic or Predictive Model, environmental metrics can be included as an extra “cost” component to resources, i.e. Carbon Dioxide Equivalent metrics, required for calculating the institutions overall carbon footprint, but more importantly being able to calculate the carbon footprint on a per Program basis or on a per “activity” or school basis so that the institution can measure the footprint but also to manage this footprint. The major benefit of this type of Carbon Accounting is that it includes all financial cost as well, so you can look for the most cost effective way to reduce your carbon footprint at a granular level.
Further Research
If you would like to see some sample reports out of the Rapid Insights model please navigate over to our Rapid Insights page on our website https://www.pilbaragroup.com/rapid-insights/