Rapid Insights
Higher Ed Financial Managers Key to Automating Financial Performance Data and Reporting
Providing you with all the data on revenue, expenses and margins for all programs in the entire institution (plus all associated courses) allowing you to perform analysis to optimize these programs to maximize margins while staying true to your mission.
Are you inundated with ad-hoc program and course financial report requests? Save significant time with a pre-built centralized, standardized and systemized model of your entire institution with all the data you need to run rapid reports in minutes not days or weeks!
Best performing Financial teams spend more time on analysis and less time on data gathering. Let us do the data gathering, cleansing and modelling for you.
Would you like to see all of your Revenues, Costs and Margins for every Program and Course across your entire institution in only days?
[ultimate_spacer height=”150″]Let us do all the heavy lifting for you!
We know exactly:
- What specific data is required from a wide-range of higher education source systems.
- How to stitch all this disparate data together, cleanse, transform and load that data into the model.
- What drivers (allocation methods) are required to ensure proper cause and effect relationships.
- What standard reports are required for initial analysis.

Solutions tailored to support every stage of your institutions journey
[ultimate_spacer height=”50″]- Financial Data
- Student Data
- Financial Data
- Student Data
- HR Data
- Timetable Data
- Financial Data
- Student Data
- HR Data
- Timetable Data
- Facility Data
- Executive, or
- Strategic Models
- CO2 Equivalent data (Electricity / Natural Gas)
- Water
- General Waste
- Recycling
- Carbon Offsets
(time to implement)

Days
Weeks
Months
Custom
Custom
![]() Curious about Environmental Insights?
Curious about Environmental Insights?
We created this Carbon Accounting solution around ten years ago with the International Federation of Accountants, CMA Canada (Now CPA Canada), CAM-I, Grant Thornton, Boeing, Weber State University, SAS, Dresser-Rand (Now Siemens Energy).
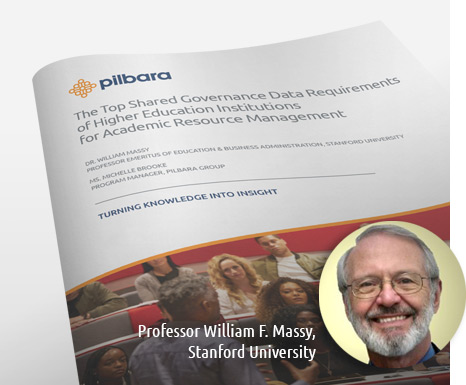
You can read about the solution in this whitepaper.
We also undertook a proof of concept model with Weber State University.
By combining both FINANCIAL cost and ENVIRONMENTAL cost in the one Carbon Accounting model, this allows you to both MEASURE and MANAGE your environmental impact and forecasted environmental and financial impacts.
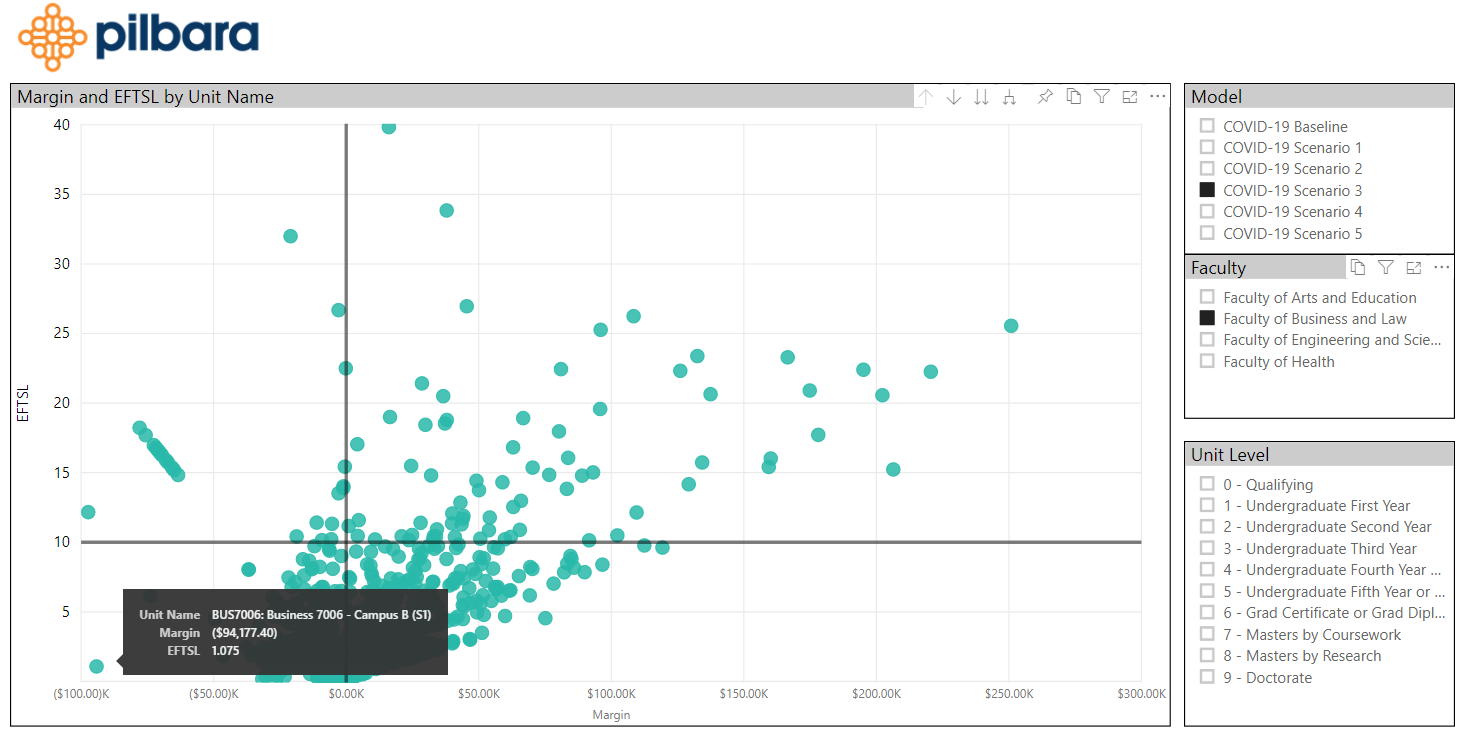
Rapid Insights example reporting
Please click on the interactive report below to explore. To see the report in full screen mode please click on the arrows in the bottom right hand corner.
- Page 1 – P&L View – You can click on a particular School/College at the top and the report will provide data for only that school.
- Page 2 – Revenue, Cost and Margin by School/Department – You can right mouse click on a college/school and drill into all underlying departments.
- Page 3 – Program and Course Relationship – You can see detailed financial metrics and Student Credit Hour for every Program and Course in the institution. Clicking on the College/School menu at the top will filter the data for that particular College/School. Clicking on a Program will show all associated courses and vice-versa, clicking on a course will show all Programs that course is taken in.
- Page 4 – Program Financials per SCH – Highlights the Revenue, Expense and Margin per Student Credit Hour for each Program Major. Clicking on the College/School menu with filter the results to that particular school.

Who we have helped with their financial transformation
[ultimate_spacer height=”100″]


“We can actually understand the full cost of our instructional programs…we’ve never had anything close to that kind of information in the past. This is the first time we can honestly understand how much they should cost and how we should resource them. Because this university has worked on a historical budget model for many years, this is revolutionary.”
~ Cynthia R. Hale
Associate Vice President for Finance and Personnel in the Office of the Senior Vice President and Provost, University of Maryland

“Pilbara’s demonstrated higher education sector knowledge has provided CQU with a model derived from granular-level data, whilst also being timely, transparent, accurate and flexible for any future CQU or sector changes. The Pilbara team are always professional and flexible, and in constant contact as to more innovative costing approaches and sector updates.”
~ Anita Anderson
Deputy Director Corporate Budget, Central Queensland University

“Understanding what drives cost in higher education is a really fiendish challenge.”
~ Dr Gwilym Croucher
Researcher at the Melbourne Centre for the Study of Higher Education at the University of Melbourne
Sign up to our Newsletter
Available Bi-Monthly

The latest conversation on Higher Education Financial Management
[ultimate_spacer height=”50″][ultimate_carousel slide_to_scroll=”single” slides_on_desk=”1″ slides_on_tabs=”1″ slides_on_mob=”1″ arrows=”off” dots_color=”#666666″]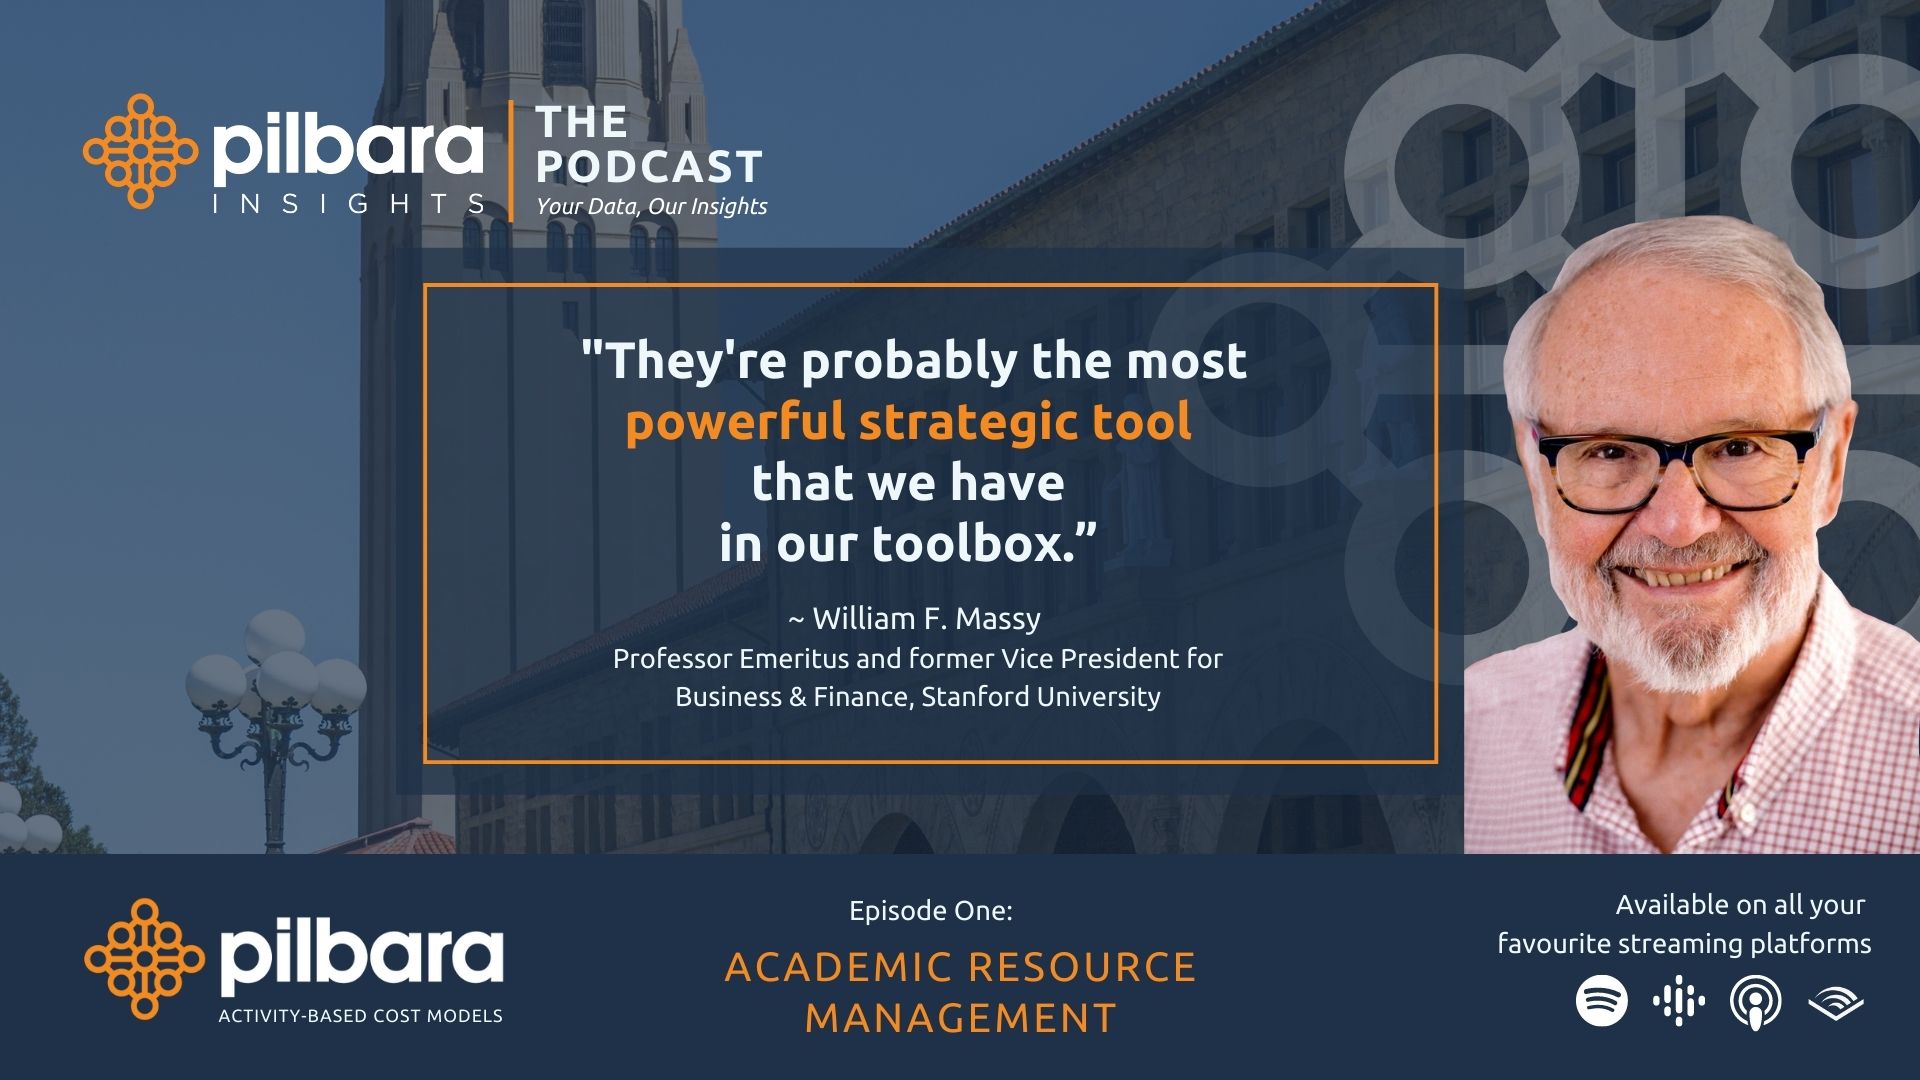
Pilbara Insights: The Podcast
The first dedicated audio series to support higher education leaders in their academic resource management decisions. The series will showcase the industries most respected and experienced experts, explore the topics of Program Review and Optimization, Course Evaluation, Faculty Effort, Departmental Research, Planning and Budgeting and the key benefits of Activity-Based Cost Modelling for evidence-based decision making.
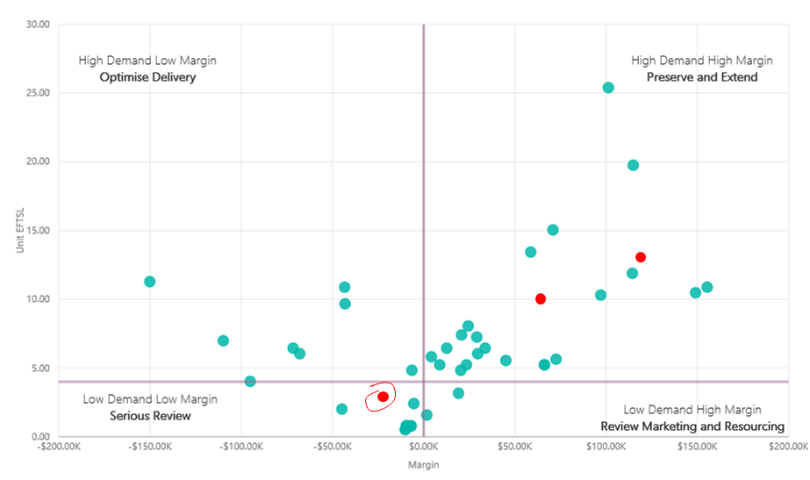
COVID-19 : Course Consolidation
The importance of understanding when, where and how each course is taught. Just because a course has low student numbers doesn’t mean it’s running at a loss
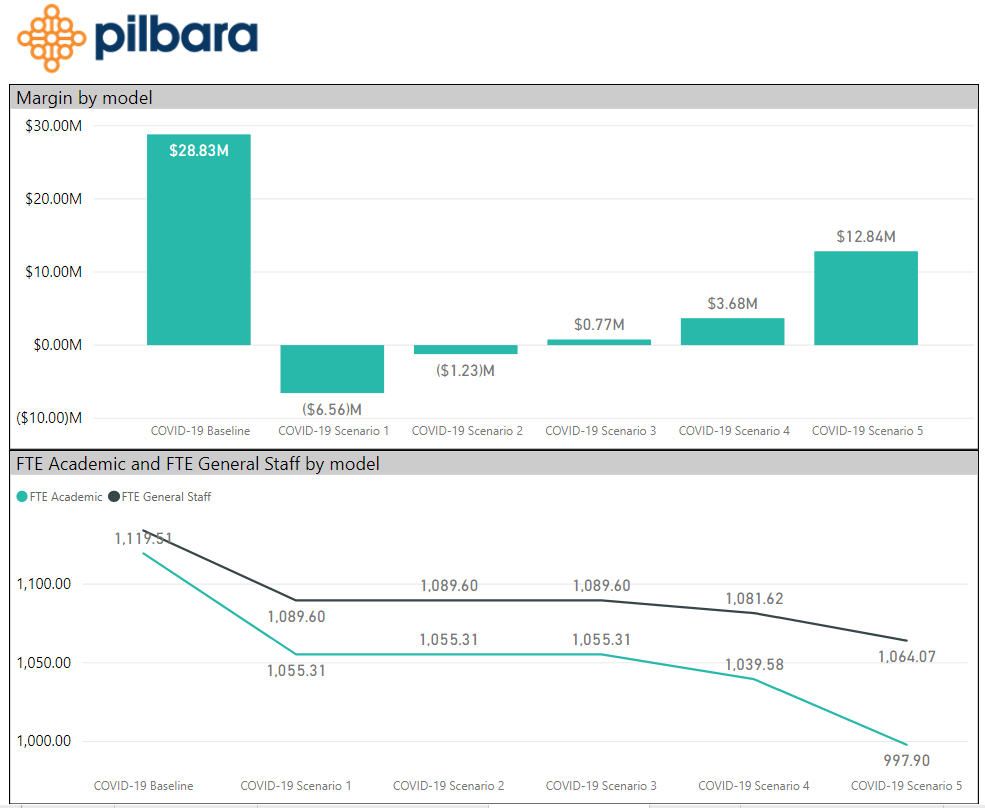
COVID-19 : Higher-Ed Crisis Management
The current pandemic is having a major impact on Higher Ed. The challenge is to navigate the current crisis but also plan for post-crisis recovery by minimizing staff cuts.
