This was a question posed by Steven Hemelt (UNC – Chapel Hill), Kevin Stange, Fernando Furquim, Andrew Simon (University of Michigan) and John Sawyer (University of Delaware) in their paper “Why is Math Cheaper than English? Understanding Cost Differences in Higher Education” https://www.nber.org/papers/w25314
Their “analysis reveals appreciable variation in the cost of delivering a unit of teaching across fields.” Spoiler Alert – some key reasons are differences in class sizes and average faculty pay. They also state that looking at metrics like average instructional costs per credit hour or performing institutional level cost analysis hide the real variation in costs happening at the discipline level.
Does an institution or state authority really need to understand this detailed cost variance? In short, yes, there are real implications in not knowing this as demonstrated in the numerous initiatives to increase attainment in STEM, which tend to be higher cost disciplines. If there is a push for more STEM students but not an appropriate increase in state funding to cover this then the institution could find themselves in financial strife!
An important caveat in the paper is that they focus on DIRECT instructional expenditures and not overhead like student services or administration. This is important because overhead can easily make up half of all institutional cost. With the inclusion of overhead, this cost variation per discipline could be even greater.
Pilbara Model
Unfortunately, the authors did not have access to detailed individual institutional data; this is where the power of the Pilbara model comes into play.
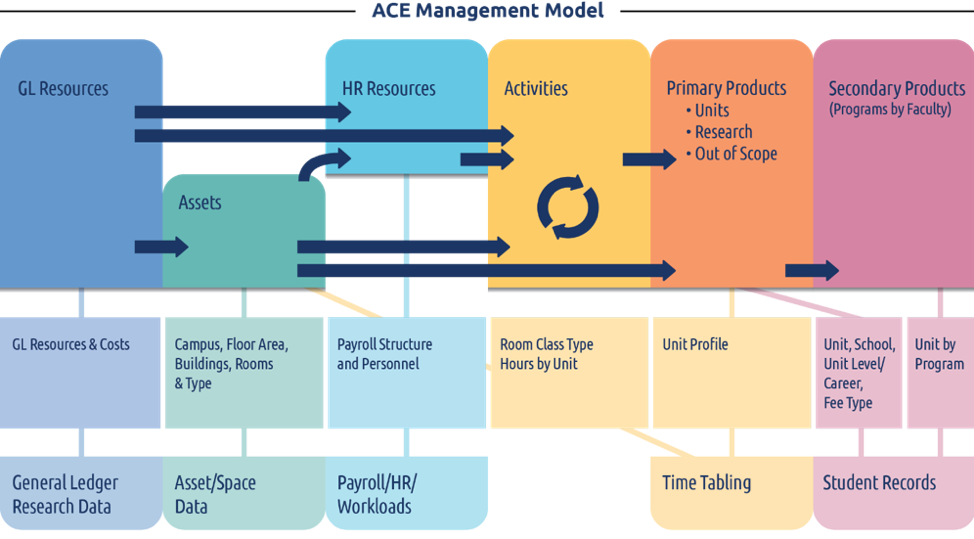
Our models contain all the data required to do this type of cost per discipline analysis for both direct and full cost (including all overhead). This analysis can also go down to subject or unit instance which includes when, where and how it is taught e.g. Accounting 101, Semester 2, Campus A, Online. As the diagram above demonstrates, the Pilbara model incorporates all five of the major corporate data sets generally used in higher education institutions, namely Financial (General Ledger), Asset/Building Management Systems, HR/Payroll, Time Tabling and Student Management Systems.
What to do with this data?
The authors state that institutions have little control over the prevailing market wages for faculty, but they could change workloads, class sizes and mix of course types (i.e. undergraduate versus graduate and in-person versus online) across disciplines to manage costs more effectively. An important point the authors make is that any changes made to teaching will affect other departmental outputs such as research productivity and the capacity for public service. Which is another benefit of the Pilbara model because it includes all aspects of the institution including teaching, research, public service, commercial entities and any sports programs.
Workloads, class sizes and course types can all be analyzed in our standard model and more advanced analysis can be done in our Predictive Model. This means workloads, class sizes, and student numbers, as an example, can all be changed to see what the resultant financial impact would be in one year, five years or even ten years into the future. Both models can be used for a wide range of other analysis as detailed in a white paper authored by Professor Bill Massy (Stanford University) https://pilbara.co/whitepaper
Specifically:
- Workload profiles
- Teaching and Research Relationships
- Teaching Delivery Options
- Identification of courses that are candidates for redesign or elimination
- Identification of programs that are candidates for investment or disinvestment
- Marginal Costs
- Price Setting
- Course and Program Relationships
- Improvement of Program Review
- Redesign the Budget Process
- Scenario Planning
What other data should be included?
The authors state that quality data should be included in this analysis.
“It is imperative to consider the effect that resource allocation decisions have on learning, instructional quality, and student outcomes and how this differs by field – especially in the light of recent evidence that ties increase in spending to higher rates of degree completion.
This next step would allow policy makers and institutional leaders to use the findings related to discipline-specific cost drivers from this paper in a manner most likely to reduce cost while upholding the quality of postsecondary educational delivery.”
I agree, it’s very important to examine quality with cost, no point in cutting cost if it’s going to have a negative impact on learning. Luckily, it’s very simple to include quality metrics in the model if the data exists. This is something that RMIT University in Australia is actively pursuing, adding teaching metrics into the model to compare cost and outcomes.
Analysis of Mathematics in the Pilbara Model
As it turns out, we did our own analysis here in Australia and selected Mathematics for analysis. The reason for selecting mathematics is because it has a healthy population of students in undergraduate programs across all universities and is taught without the need for specialized equipment, rooms or placements. It also covers a range of subjects found in a variety of schools including science, health, computing and business.
By benchmarking 10 Australian institutions we discovered a swing of around 60% between the lowest and highest cost of teaching. The next step is to look at the average subject size i.e. how many subjects are being offered across how many locations, delivery modes and semesters.
It takes a lot more effort to teach 100 students in 10 separate subject instances, than it does to teach 100 students in a single instance.
The differences in cost turn out to be the same issue identified in the paper – class size. The most expensive university had small classes across multiple campuses while the least expensive had one large centralized school.
It’s important to note that neither cost is bad, the more expensive institution must provide teaching across multiple campuses because it is a rural institution and needs to provide teaching to students spread across a large geographic area. Quality metrics have not been included, so there is no indication whether the larger class is better or worse for students.
The fact that these costs and root causes for these costs in made transparent means that the institutional can look at ways of managing these costs in a more effective manner.
High cost is not necessarily bad cost, hidden cost is the enemy! Making all costs transparent makes it a lot easier to manage.
If you would like to read about this analysis in a little more detail, then the full article can be found here: https://www.pilbaragroup.com/cost-of-teaching-lets-benchmark-and-look-beyond-just-the-cost-per-eftsl/
 Resource Management for Colleges and Universities
If you would like to read more about these types of detailed Academic Resource models then Professor William Massy has completed his latest book Resource Management for Colleges and Universities, available for pre-order now at Johns Hopkins University Press.
How comprehensive activity-based models can help university leaders and faculty reshape their institutions through better resource management.
“In this audacious book, William F. Massy writes that resource allocation in colleges and universities needs to become more responsive to academic mission, marketplace realities, and the requirements of financial sustainability. Such improvement is needed, he asserts, because few institutions currently have the evidence, know-how, and cultural capacity to take advantage of modern information systems and models. Luckily, today’s academic resourcing models enable academic leaders and faculty to close the gaps and do a significantly better job of controlling costs and improving academic performance…..Building on Reengineering the University, Massy’s earlier book, Resource Management for Colleges and Universities will provide readers with the wherewithal, and the motivation, to fundamentally transform their institutions.”