Understanding the Landscape
Civil Engineering stands as one of the foundational disciplines in higher education, yet its financial performance reveals fascinating insights when compared to peer engineering programs and non-engineering fields. Using comprehensive Australian sector benchmarks1 from 2024, we can uncover patterns that transcend borders and offer valuable lessons for universities worldwide.
The Cost Efficiency Story
At the Bachelor level, Civil Engineering demonstrates remarkable cost efficiency with a weighted mean cost per EFTSL (Equivalent Full-Time Student Load) of $16,908 in 2024. This positions it favorably against other major engineering disciplines: Mechanical Engineering comes in at $18,268, while Electrical Engineering is notably higher at $20,068.
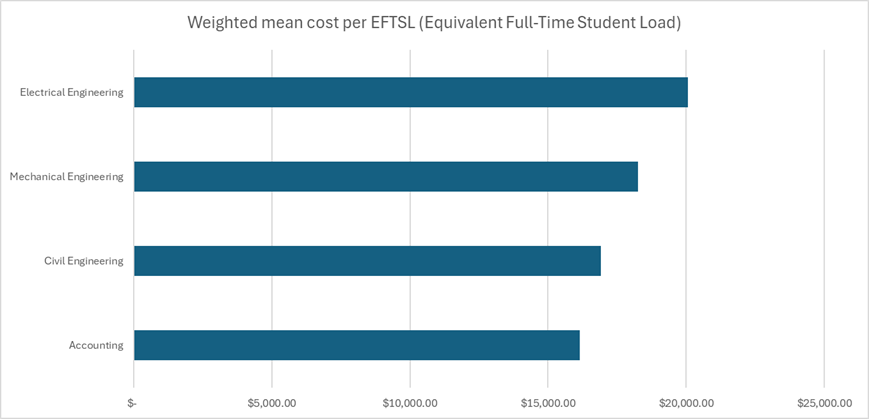
Perhaps most striking is the comparison with Accounting—a traditionally “cheaper” discipline—which costs $16,140 per EFTSL. Civil Engineering delivers a complex, laboratory- and field-intensive program at costs only 5% higher than a primarily classroom-based business discipline, demonstrating exceptional operational efficiency.
The Productivity Paradox
Civil Engineering achieves this efficiency through impressive academic productivity. Each academic FTE supports 50.8 EFTSL—significantly outperforming Mechanical Engineering (36.4 EFTSL) and Electrical Engineering (34.1 EFTSL). This high student-to-faculty ratio, combined with 34.8 delivery hours per EFTSL (lower than Mechanical’s 34.6 and Electrical’s 40.4), suggests Civil Engineering has optimized its teaching delivery model.
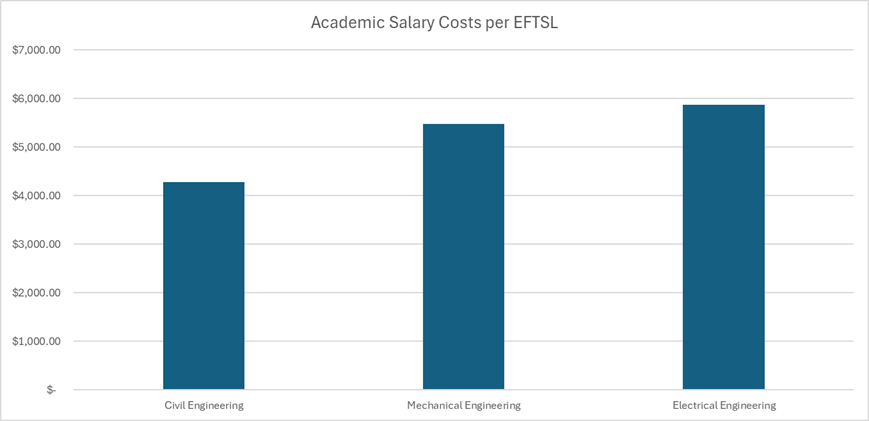
However, this efficiency comes with potential risks. Academic salary costs per EFTSL for Civil Engineering sit at only $4,287, substantially below Mechanical ($5,478) and Electrical ($5,874) engineering. While this drives cost efficiency, it raises questions about long-term faculty retention, research capacity, and teaching quality in an increasingly competitive academic marketplace.
The Cost Structure Breakdown
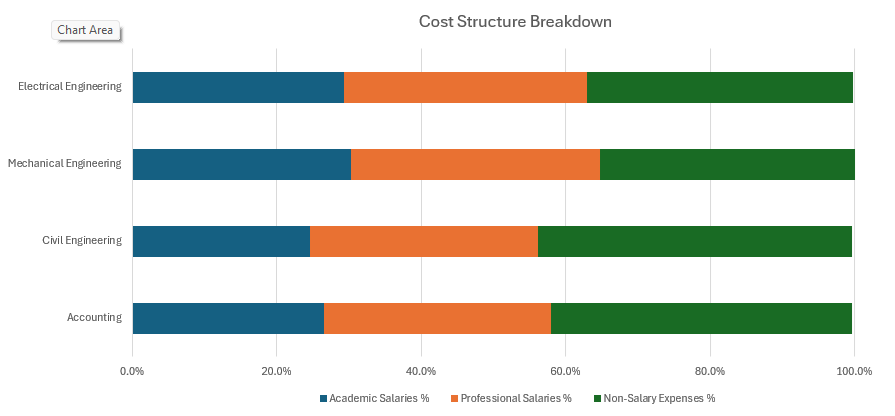
The expense composition reveals Civil Engineering’s unique characteristics:
- Academic Salaries: 24.6% (vs. Mechanical 30.3%, Electrical 29.3%, Accounting 26.5%)
- Professional Salaries: 31.6% (vs. Mechanical 34.5%, Electrical 33.7%, Accounting 31.5%)
- Non-Salary Expenses: 43.4% (vs. Mechanical 35.2%, Electrical 36.8%, Accounting 41.6%)
Civil Engineering’s elevated non-salary expenditure reflects the discipline’s inherent requirements: laboratory equipment, field study costs, software licenses for structural analysis and CAD tools, and infrastructure maintenance. This 43.4% allocation is the highest among the engineering disciplines examined, highlighting the capital-intensive nature of civil engineering education.
Trends Over Time: A Concerning Trajectory
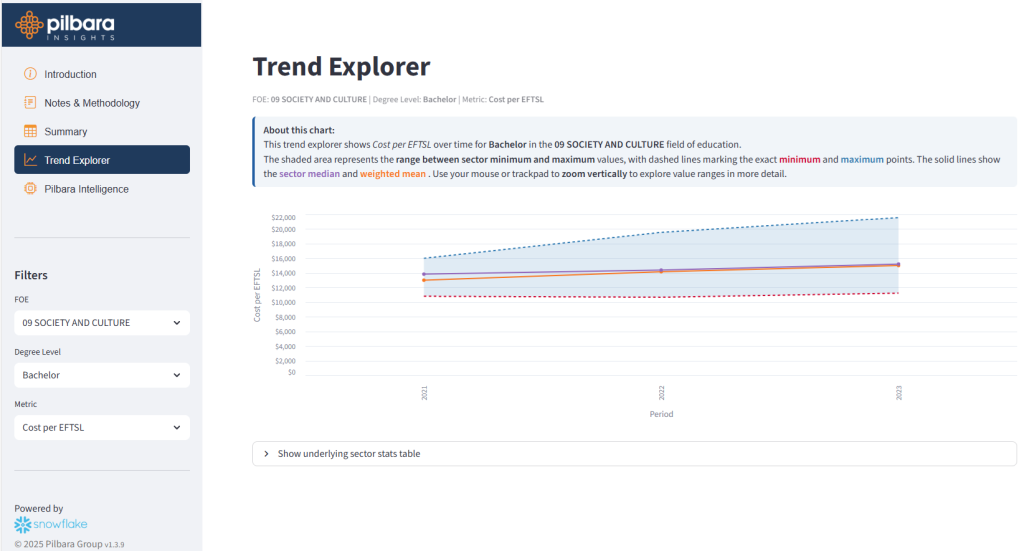
Analyzing Civil Engineering’s four-year trend (2021-2024) reveals a worrying pattern. Cost per EFTSL has grown from $14,751 in 2021 to $16,908 in 2024—a 14.6% increase. Yet academic salary per EFTSL rose only 17% (from $3,663 to $4,287), barely keeping pace with inflation while overall program costs accelerated.
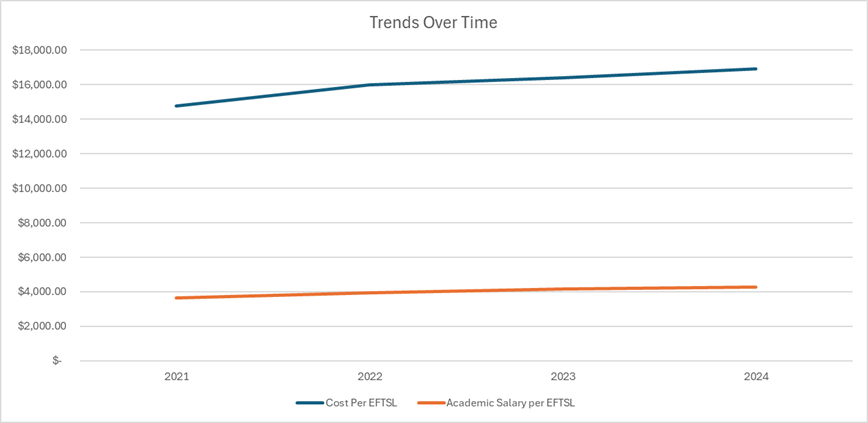
This divergence suggests the non-salary cost burden is intensifying, likely driven by depreciation of expensive equipment, rising software licensing fees, and increasing compliance costs. The weighted mean depreciation per EFTSL jumped from approximately $2,000 in early 2020s to $3,047 in 2024—a significant contributor to overall cost pressure.
Global Relevance: Why Australian Data Matters Internationally
While this data originates from Australian universities, its relevance extends globally for several reasons:
- Universal Cost Drivers: The fundamental economics of engineering education—laboratory requirements, specialized facilities, faculty qualifications, and industry-standard software—transcend national boundaries. A structural analysis lab in Sydney faces similar cost pressures as one in Stuttgart or Singapore.
- Benchmarking Standards: Australian universities use activity-based costing methodologies aligned with international best practices. The metrics (cost per EFTSL, delivery hours, academic FTE ratios) are directly comparable to UK’s student-staff ratios, US cost-per-credit measures, and European ECTS systems with simple conversions.
- Market Position: Australian universities compete globally for students, faculty, and research funding. Their cost structures reflect international competitive pressures, not purely domestic factors.
- Sector Maturity: Australia’s tertiary education system represents a mature, diversified market with public and private institutions, metropolitan and regional campuses—mirroring the complexity found in North America, Europe, and increasingly Asia.
Strategic Recommendations for Financial Performance Improvement
- Optimize Academic Staffing Models
Current EFTSL per academic FTE (50.8) is sustainable but risks quality degradation. Consider targeted investment in academic salaries (currently 24.6% of costs) to attract mid-career academics who can balance teaching efficiency with research income generation. A modest 2-3 percentage point shift toward academic investment could strengthen research output, attract postgraduate students, and enhance undergraduate teaching quality.
- Address the Non-Salary Cost Challenge
At 43.4% of expenses, non-salary costs demand strategic attention:
- Equipment Sharing Consortia: Form regional or national equipment-sharing arrangements for high-cost, low-utilization items (e.g., advanced testing equipment)
- Software Licensing Optimization: Negotiate enterprise agreements for BIM, structural analysis, and CAD platforms
- Maintenance Efficiency: Implement predictive maintenance programs to reduce reactive costs
- Revenue Diversification Through Industry Partnerships
Civil Engineering’s practical nature enables strong industry connections. Structured partnerships can:
- Generate revenue through consulting services and materials testing
- Reduce equipment costs via industry equipment loans or co-investment
- Enhance placement opportunities (currently averaging 0.4 placements per EFTSL—room for significant growth)
- Teaching Delivery Innovation
With delivery hours per EFTSL at 34.8 (median of 33.8), there’s opportunity for evidence-based innovation:
- Hybrid Laboratory Models: Combine physical and virtual laboratories for preliminary concept development
- Block Delivery Optimization: Restructure intensive field components to reduce per-student costs through larger cohorts
- Peer-Assisted Learning: Leverage high-performing students in structured tutoring roles
- Strategic Enrollment Management
The median Civil Engineering program enrolls 98 EFTSL with significant variation (range: 4-883). Programs below 150 EFTSL face disproportionate fixed costs. Strategic responses include:
- Specialization Clustering: Combine related specializations (structural, geotechnical, water) in first two years
- Cross-Institutional Collaboration: Share specialized third-year units across universities regionally
- International Market Development: Target high-demand international markets where Civil Engineering commands premium positioning
Conclusion
Civil Engineering demonstrates strong cost efficiency compared to peer engineering disciplines, driven by high academic productivity and optimized teaching models. However, the 14.6% cost escalation from 2021-2024, driven primarily by non-salary expenses, demands strategic intervention.
Universities that proactively address the non-salary cost burden while making selective investments in academic capacity will be best positioned for sustainable performance. The discipline’s strong industry connections and practical orientation provide unique opportunities for revenue diversification that less applied disciplines cannot easily replicate.
For international institutions reviewing these Australian benchmarks, the key takeaway is clear: Civil Engineering’s financial performance hinges on balancing operational efficiency with strategic investment in areas that drive both educational quality and research excellence. The programs that master this balance will thrive in an increasingly competitive global education market.
Would you like to learn more about the Pilbara Benchmarks?
You can download the brochure here:
You can request a demo of the benchmarks here:
- The benchmarks are derived from detailed Activity-Based Cost Models spanning multiple institutions and multiple years. The underlying dataset contains approximately 9 billion rows, which are rigorously curated and refined to a high-quality benchmark dataset of around 100 million rows. [↩]