
Last year NACUBO released the results of their survey to understand the current status of analytics, where Business Officers would like to use analytics and barriers that institutional leaders face within the Education sector.
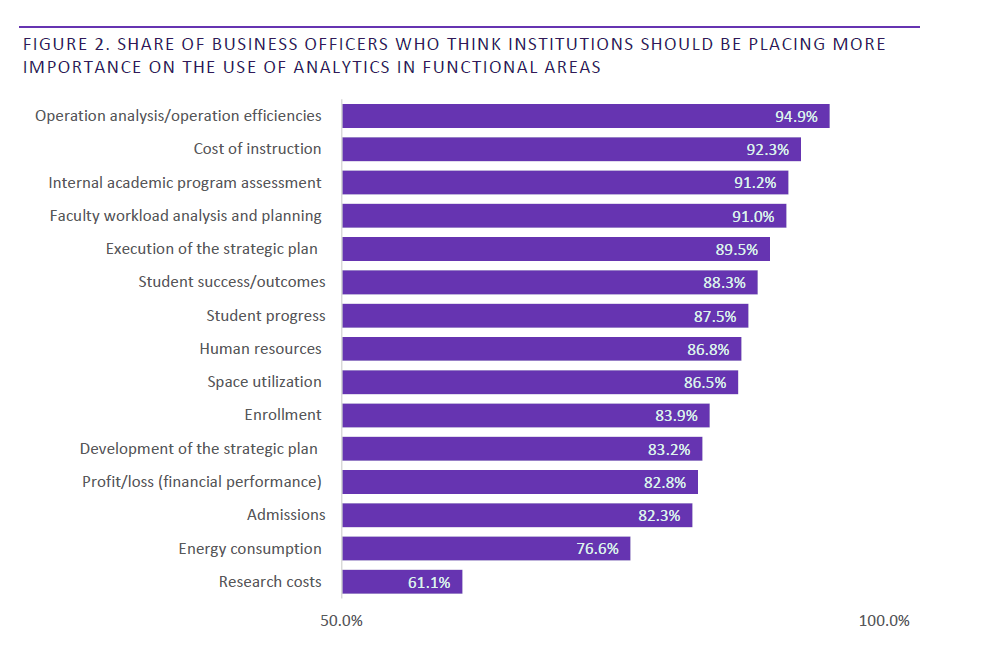
As the results show below, Operational Analysis and Cost of Instruction top the list of areas that are in need of greater use of analytics.
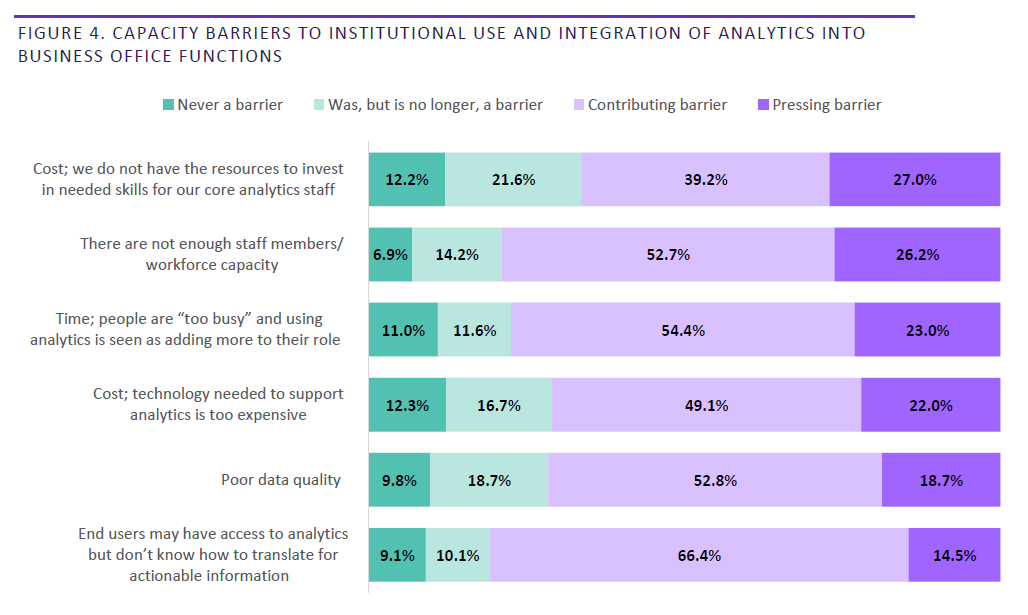
Breaking the results down further, capacity barriers to leaders are shown below – in summary not having enough money, people or time are the biggest deterrents.
What if we could build one big analytic model to address the majority of the required uses of analytics and do all of the heavy lifting to address people and time constraints and build the model in only seven weeks?
The seven week time frame is something that surprises a lot of institutions when we tell them about our model implementation. Of course this is dependent on getting all the required data in a timely manner from the institution and quick turn around on any questions we may have, but in general the actual consulting time on our side averages seven weeks. So how can we do this when numerous institutions have been wrestling with their own modelling and analytics projects for years? Basically it comes down to twenty years’ experience in building large scale complex models for a range of industries including the military, oil/gas, government and, for the last ten years, models that specifically focus on higher education. During that time we have worked out a number of ways of streamlining and improving the model build and update process and it’s always getting better.
Our standard model can address the following requirements immediately: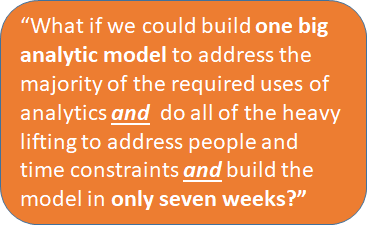
- Operation analysis/operation efficiency
- Cost of Instruction
- Internal Academic Program Assessment
- Faculty workload analysis and planning
- Human Resources (as in what they are working on), including non-academic personnel
- Space Utilization (Standard Model)
- Enrollment (as in numbers and types of students enrolled in different courses/programs)
- Supporting aspects of the development of Strategic Plans
- Profit/loss (financial performance)
- Research Costing
A major benefit of the model is that it can easily be enhanced, if the data is available, to address the following:
- Student success/outcomes (aggregate not individual student results)
- Energy Consumption (Environmental Management Accounting Model – will calculate energy consumption down to individual course/programs with associated Green House Gas Emissions calculations)
![]() Let’s take a look at a recent model implementation with Central Queensland University – this is a great case study because it relates specifically to our Executive Model, which is the model that can be implemented in seven weeks. Note that this model was developed to specifically address an Australian Federal Department of Education requirement to report the Cost of Teaching. However, once the model is implemented it can address a wide range of business requirements including those listed above based on the NACUBO
Let’s take a look at a recent model implementation with Central Queensland University – this is a great case study because it relates specifically to our Executive Model, which is the model that can be implemented in seven weeks. Note that this model was developed to specifically address an Australian Federal Department of Education requirement to report the Cost of Teaching. However, once the model is implemented it can address a wide range of business requirements including those listed above based on the NACUBO 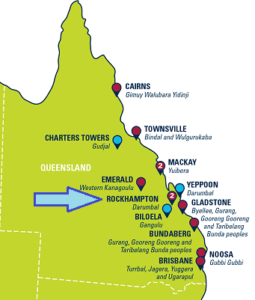 Analytics Survey.
Originally founded in Rockhampton in 1967 as the Queensland Institute of Technology (QIT) Capricornia, the institution was granted full university status in 1992. CQU has experienced phenomenal growth in recent years seen by the remarkable growth in student numbers, new courses, new campuses and infrastructure. There are currently 30,000 plus students from more than 70 countries. It has firmly established itself as one of the largest universities based in regional Australia, with campuses in over 25 locations including Adelaide, Brisbane, Bundaberg, Cairns, Emerald, Gladstone, Mackay, Melbourne, Noosa, Perth, Rockhampton, Sydney and Townsville. CQU was ranked as one of the world’s best universities under 50 years of age by Times Higher Education and QS World University Rankings.
Setting the scene
In January 2018 CQU’s funding agreement included the following paragraph:
“The university must provide data relating to revised transparency arrangements as requested, including in relation to admissions processes and the cost of teaching and scholarships. This will include providing the data in the form and at the times required to support the national admissions platform”
In May 2018 the Department of Education’s ‘Transparency in Higher Education’ submission is released and 25 Australian universities were required to report in 2019 (all are required to report in 2020).
CQU had no Activity-Based Cost model in place to address this reporting requirement and they had limited availability of key resources to complete the Department’s costing exercise. Given the impending deadline they determined that if they were going to do this, then they had to complete it within six weeks and prior to the 2018 end of financial year.
Why did CQU choose the Pilbara Executive Model?
- Low impact on staffing resources
- Rapid implementation
- Pilbara Group have 20+ years’ experience in developing cost models and ten specifically in Higher Education
- The Executive Model can easily be migrated to a full model over time as required
- Provides finance and academic users with the ability to understand the model over time by starting with a simpler methodology and then evolving the complexity and requirements over time
- Benchmarking against Pilbara’s existing university clients (over 25% of all Australian universities)
- Allows finance and academic staff to focus on the outputs and interpretation of the results rather than the actual build process.
The Pilbara Executive Model
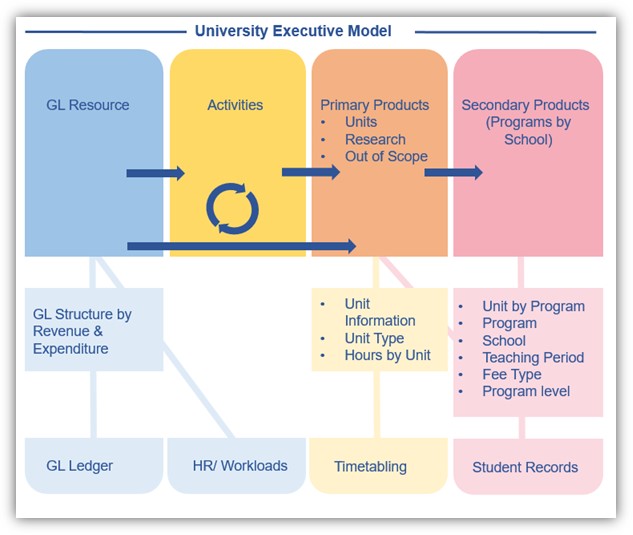
A principle aim of the model was to utilise CQU data to minimise manual intervention and use institutional data where possible:
- Finance
- HR Payroll
- Academic Workloads
- Student Records
- Timetabling
The objective was to build a system using business rules and profiles so that it was as automated as possible. This was achieved initially by starting with high level rules that aim for 90% accuracy for 10% effort and then cascading those rules down through the organization. This meant central rules were developed initially but individual schools or individual people could easily change these rules where required.
This resulted in a model that is:
- Highly automated (very little manual maintenance)
- Extremely flexible – can adapt to changing circumstances (i.e. dual sector changes, new campuses, etc.)
- Single source of truth
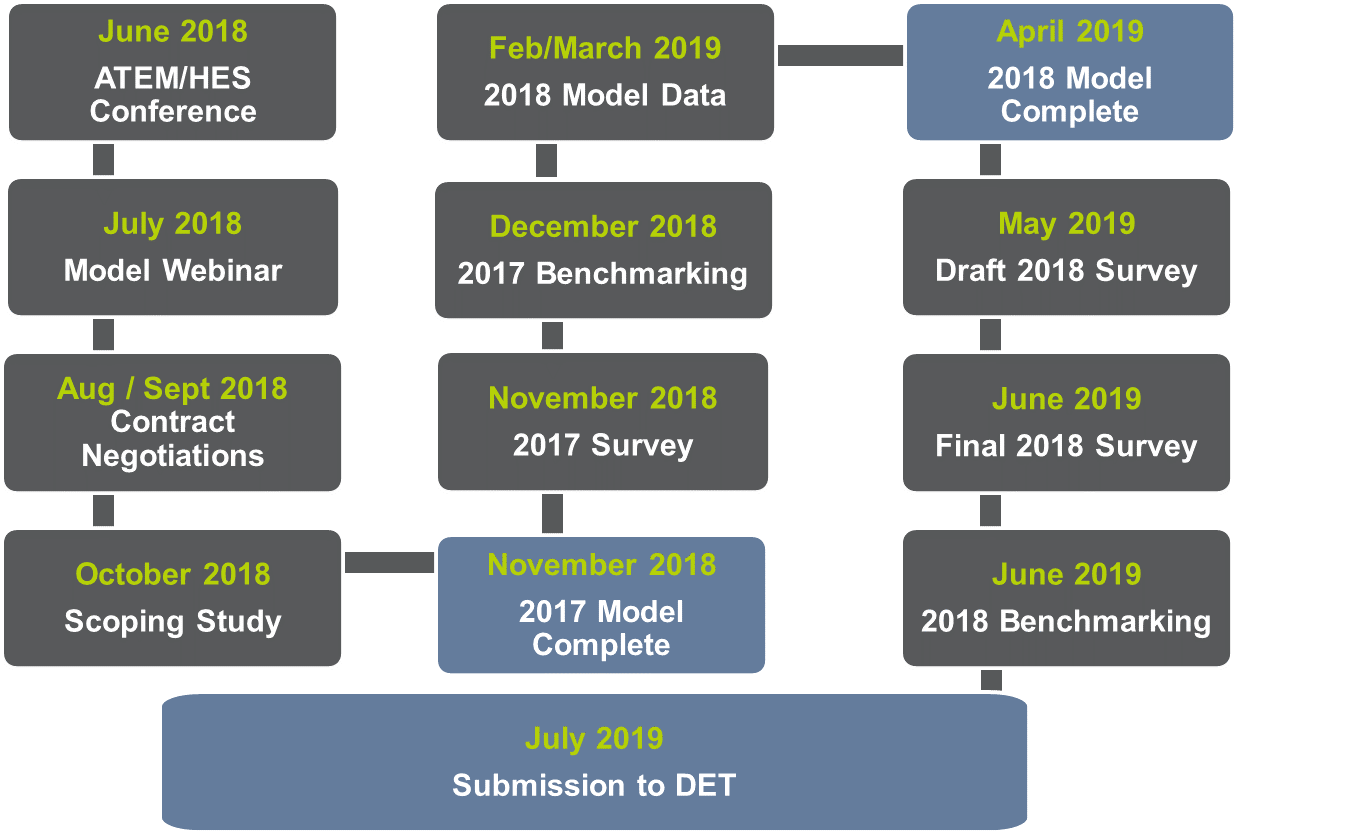
12 month timeline
The following timeline highlights CQU’s full journey from initial introduction to the Pilbara model through to initial model build and subsequent model update.
Outcomes
- The model was built using GL, HR, Academic Workload, Student and Timetabling data
- The 2018 model costs over 4,700 units (over 23 campuses, 3 delivery methods and 3 teaching periods) and over 1,850 courses (degrees)
- It also costs research, commercial/trading and out-of-scope products
- It takes just over 3 minutes to calculate
- The 2018 model has over 31,400 created paths – this results in over 201,000 actual allocation paths
- Over 40 reporting dimensions and over 60 measures are available in the model reports
- Reporting is via Excel and Microsoft PowerBI
Words of advice from CQU
Don’t leave it too late
- Commence requirements and scoping early – data cleansing may be required
- Avoid the dreaded ‘Mother of all Spreadsheets’
Listen, look and investigate
- Can it be easily updated each year?
- Is the knowledge held by one person? What happens if they leave?
- Data ownership – retained by University?
Build once, use multiple times
- Can the proposed model be further enhanced and refined over time?
- Fee setting
- Margin analysis
- Cost research as well as teaching?
Benchmark
- Peers, networks, Pilbara Group – do it prior to submitting
- Provide a level of confidence in results being submitted, and credibility to University Senior Executive – do not underestimate this!