I just read this article by Kevin R. McClure, associate professor of higher education at the University of North Carolina at Wilmington on Academic Burnout. To quote the article “The pandemic has introduced unique challenges for faculty and staff in higher education that may make burnout even likelier to occur…Summer is normally a time of restoration for faculty and staff, and many believed that if they could just finish spring semester, they would have a chance to recover, said Renee Cramer, chair of the Law, Politics, and Society Department at Drake University, who has been researching ethics and the academic workforce as part of a three-year project. But “there’s been no recovery,” she added. Cramer reports seeing a much higher level of burnout, and the result is that faculty “are walking into the classroom, wherever that is, in three weeks already exhausted.”
This got me thinking about the models we develop for institutions, which are primarily focused on cost and all of those resources that make up the full cost to the institution for teaching, research, community support and commercial enterprises, collectively identified as the “outputs” of the institution. This comes under the banner of Activity-Based Costing or as Professor William Massy describes it in this latest book, Academic Resource Models.
People are usually the biggest expense at an institution, so being able to map each individual to the activities they perform and then to the final “output” they support is core to the model. Most institutions don’t use time sheets, so this means that we had to create our own unique profiling methodology. One of the side benefits of this process is measuring the amount of time faculty spend on activities and tasks, which enables us to compare available working hours with estimated working hours based on these profiles.
In the example below the School of Computer Science is required to provide more hours (the estimated ‘Hours Delivery’) than they were paid for in that year (‘Supplied AC Hours’ – this data comes from actual ‘hours paid’ via payroll data). It should be noted that this example is an annual snapshot, we could update this snapshot on a semester basis or indeed use our predictive model for forecasting.
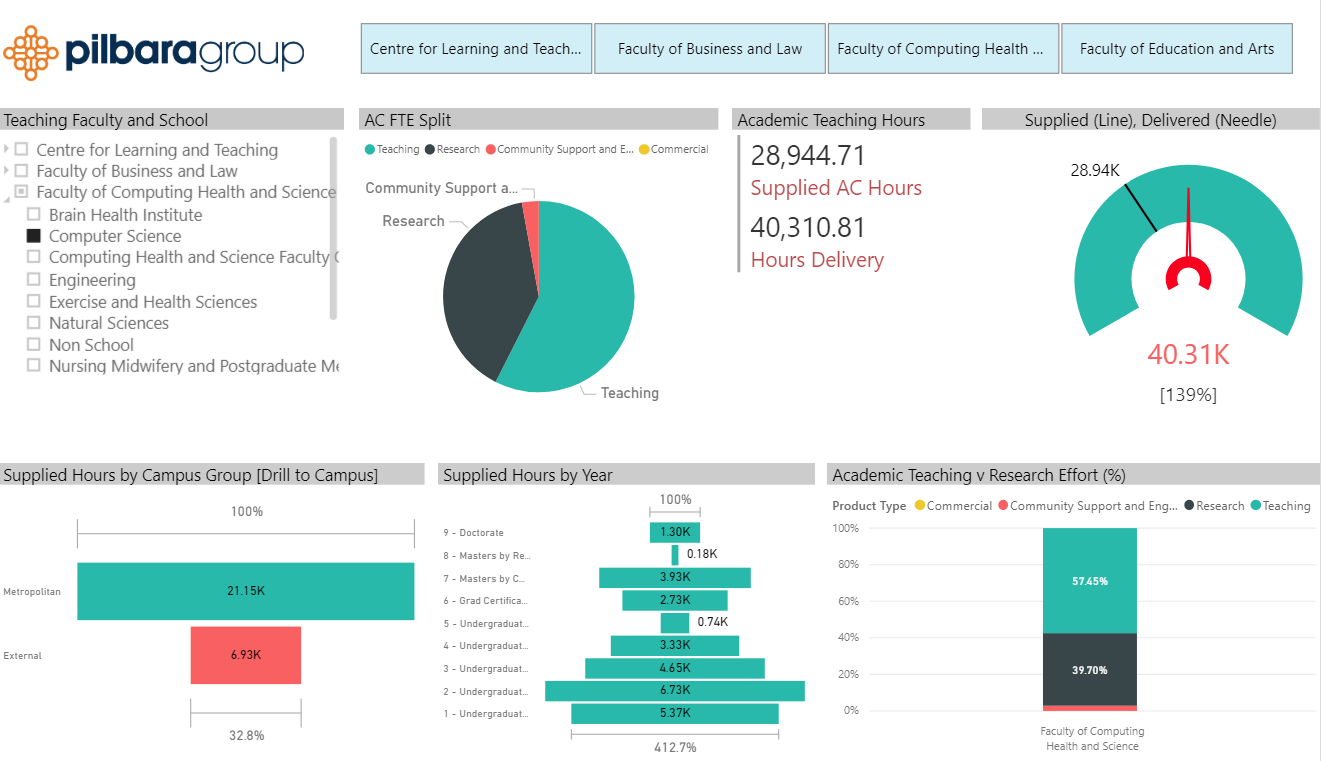
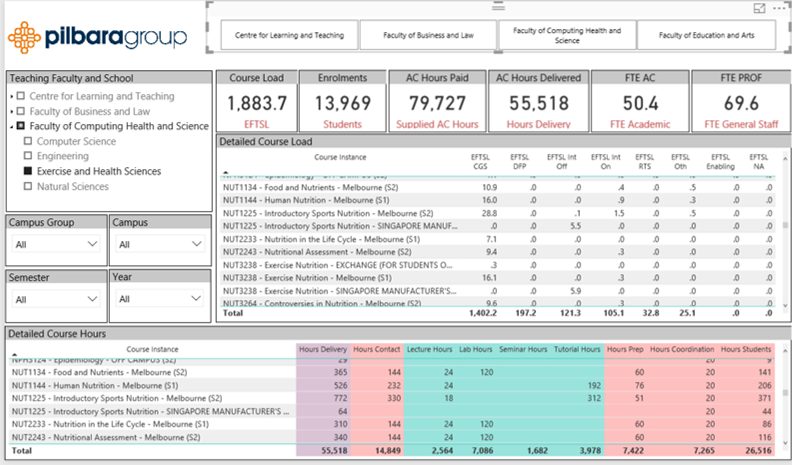
These profiles are constructed in two parts. One is a high level break down between Teaching, Research, Community Support. The other is a break down on a per-course basis firstly breaking down the delivered hours into Contact Hours, Preparation Hours, Student Hours (marking and assessment etc), and Coordination Hours, and then secondly, breaking the Contact Hours down into class type, for example:
- Lecture hours
- Lab Hours
- Seminar Hours
- Tutorial Hours etc.
This breakdown can be shown at the Course instance level. Course instance is defined as where, when and how an individual course is taught, so a course taught in Campus A, Semester 1, Classroom is a different instance to the same course taught in Campus B, Semester 2, Online.
Impact of Covid-19
One of the biggest impacts of Covid-19 has been the rush to move all courses online. This has lead to a significant amount of additional workload for both Faculty and supporting staff for scanning, migrating, setting-up a wide-range of various online tools from dedicated Learning Management Systems to Microsoft One Note (as an example). In the US, this is occurring or has occurred over the summer relaxation/downtime period, in Australia it was the beginning of the year, but both have had to deal with this unexpected additional workload.
Then comes the actual teaching part – both Faculty and students have to learn the new technology. I know first hand what this was like when both my high school boys were at home at the beginning of the pandemic and both my wife and I were working from home. I was sharing the dining room table with my boys and it seemed like the first 15 minutes of every lesson was a discussion back and forth on where to find the notes, files, exercises etc.
We also discovered by examining a number of existing university models with native online courses (not the madly rushed to online versions) that the time for student support is greater on a per-student basis for online courses than for classroom courses. This could be due to the fact that lecturers may seem more available in the online world and will be inundated with email, chat, video call requests.
So what does this all lead to? More time is required to teach the standard curriculum at the same time as universities and colleges are cutting staff to address the financial impacts of Covid-19. Where does this extra time come from? Research time and after-hours time of the individual academic.
So what can be done? Some institutions will be looking to reduce the workload by cutting certain programs or courses. The problem here is that will also reduce revenue, so it’s very important to understand the financial implications of this. It’s also important to understand the workload required to support each course, some courses may be less burdensome than others so comparing workload and margins is important.
This is not an easy process and requires balancing Faculty workload and financial sustainability of the institution. The health of staff should be a number one priority, both from the Covid-19 perspective but also mental health to avoid burnout.
A good step towards managing the mental health of Faculty members is to measure their current workload and estimate anticipated workload in this “new normal”. This can help flag areas of concern where the needle is indicating overworked staff and then going back to Kevin’s article look at some of the ways he suggests managing this, namely:
- Break the silence and stigma around burnout
- Simplify and reduce work whenever possible
- Evaluate and improve work conditions
- Embrace flexibility
You can find more information on academic workload profiles here.