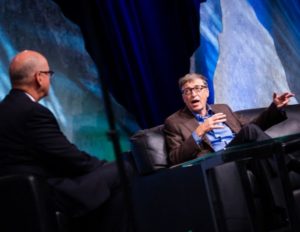
 Bill Gates recently presented at the National Association of College and University Business Officers (NACUBO) Annual Meeting, where he spoke about America’s greatest asset being the Higher Education system. There were a number of key points that came out of his speech and Q&A session.
Dramatic changes are coming to colleges, it’s no longer good enough to fine tune the business model; there is going to be a need for a major overhaul.
Revenue sources are not going to grow as costs go up; government funding is declining and is unlikely to ever go back up. Families are struggling to meet rising tuition.
Innovative technology is driving some of the changes in higher education, including MOOCs, but they are simply one element of a possible hybrid system that integrates online content pieces with study groups, labs, and discussion sessions to support the needs to students.
Then he asks a series of very important questions. “How can you find best practices? Which are the students that you’re losing the most money on—not that you should change this, but you should know. Who are you making the most money on? Who are the students that are most disappointed? Who are the students who are most pleased with what’s going on? You’ve got to start with that picture in mind and then ask other institutions “how did you achieve that and why is that thing going so well?”
He goes on to state that it is ironic that academic institutions are good at studying other parts of society “…but, I’d say, in terms of turning that lens on yourself and saying are certain degree programs subsidizing others, is that appropriate? Are there certain degree areas that some universities should get out of and specialize more, go for scale and things that you’re particularly strong in, those questions simply haven’t been asked, and this new environment will force them to be done.”
These are all excellent observations but what can be done to address all of these issues? There is one vital asset inside universities that is greatly underutilized and that is DATA. There is a wealth of data available to academic and administrative leadership if they choose to use it. It will come as no surprise that Bill Gates is a huge advocate of using data and measuring as much as possible.
This goes beyond the spreadsheet and the data warehouse. Speadsheets are excellent for one-time analysis of particular issues, but once they become multi-user, enduring solutions they are cumbersome and error prone. Data Warehouses were all the rage, but without any compelling business case a lot of them turned into data basements.
We need something new and powerful.
The Maze
Imagine a Maze, a massive maze, a maze that would take you a good few hours to navigate. It has one entry and one exit and it is fun for all the family. Now imagine that maze with one thousand entries and one thousand exits and one thousand people navigating it simultaneously. Things start to get a little more complex and stressful, not so much fun anymore, the kids are desperately searching for the emergency exit signs and are starving, as usual.
What we need to do is carefully map a path for each of these people all the way through the maze to their appropriate exit. To add a bit more complexity to this problem, the entries, exits and the actual maze can all change over time.
This map of the maze is what we call the MODEL.
The Model
A university can easily have thousands of resources including people, buildings and money that need to be mapped through the maze to end up at their appropriate exit which could be grouped into teaching, research, community support and sports programs.
Having a full picture of the institution provides powerful insight into the way the institution actually operates, not just how it is reported. The model includes “causal” relationships, which means when one thing changes it impacts something else in a very definable way.
So if the model is so fantastic why isn’t everyone using one? Because it’s hard, or I should say it was hard. Let’s go back to the maze, back in the old days we had to walk around with clipboards (yes clipboards and paper) and interview all the people who came out of the maze and ask them which way they went. Imaging doing this for thousands or tens of thousands of people – it was time consuming, expensive and painful. Then when you wanted to update the model, you had to do it all over again, so no one did it again.
Why is now any different? Because we have data, and lots of it. This includes data on financials, personnel, buildings, courses, students and more importantly data that can be used to define the causal relationships. So good-bye manual surveys, say hello to model automation. This saves a lot of time in building but also updating/maintaining the model.
This data comes from transaction-based systems that cost millions or tens of millions of dollars to setup and maintain. Hence being able to use this data for a secondary and powerful purpose is very valuable.
And it doesn’t stop there, consider this the start of the journey. Once you have a full picture of the way the university actually operates over a number of years, the next stage is to start building models that can predict what could possibly happen. Also with multiple institutions adopting a consistent methodology then all of these models can be analysed, compared and detailed benchmarks can be developed.
The good news is that it is happening, right now, all the way down-under. Over the past seven years a number of Australian universities have implemented the primary model (University Management Model), have sufficient number of annual models to migrate to the Predictive Model and there are now a sufficient number of individual institutions that have opted into the initial benchmarking and analysis project. It’s also all cloud-based so makes the overall management of the solution even more efficient.
These models are specifically developed to answer the exact questions posed by Mr. Gates – Which courses are making money and which are losing money? Which student types contribute the most revenue to which courses? What is subsidizing what? How do you compare to other institutions? As well as a wide range of other executive decision making questions.
Where data is available you can easily add your particular performance metrics into the model, so you can see the relationship between costs, teaching time/contact hours, content delivery type (classroom, online, tutorial) and student learning outcomes.
This way the “black box” is blown open, academics and administrators can all see the inner workings of their institution. They can all work together with complete transparency and ensure the mission of the institution is properly considered as well as the financial aspects. A major benefit of the model is that it is ultimately flexible as well, so if the institution goes through a major reorganization, decides to unbundle a bunch of courses, removes courses or whole schools, moves parts of teaching online, these can all be represented in the model relatively easily.
Data is a powerful asset and something that should be utilized in more powerful ways – to ensure the academic goals of the institution are met in a financially sustainable way.
Bill Gates is very smart and always asks thought provoking questions. He is right when he is asking higher education leaders to use the lens to analyze whether all things they do need to be done in ways they have been doing. Well his assumption is that higher education can change overnight, in one week, one month or even a year. Most institutions have “traditions and cultures” put in place for decades and changing anything may lead to faculty/staff vote of no-confidence in dean, Provost, and/or Presidents. Is it worth going through such an exercise and the cost one pays? Generally our faculty, the most intellectuals but with highest degree of ego and the heart of our academy, are the last one to support CHANGE or even be rationale to instituting the change. Having been in higher education for more than three decades in various roles, I have seen faculty making statements that Presidents come and go; we are here for the long haul- it is the reflection of their ego. On the other hand, Presidents/Provosts do have a revolving door and they want to make a MARK before moving on; their MARK may have little to do with the realities of the institution culture and realities. Thus egos clash and the whole thing turns into a “political” game. In other situations local legislators/lawmakers, state/federal government, system heads have their own egos and misconceived ideas that they believe are the BEST thing to do with no relation to reality. They create unfunded mandates which are often impossible to implement. Union cultures are hardly ever helpful in bringing the needed change; I am always struck by the fact that higher education faculty with “doctorates’, the most intellectuals of all have formed unions to assert their working conditions and fair wages. In my limited view these intellectuals are not “labors” so why unions; it appears to be an oxymoron when I think of faculty unions. While Bill Gates’s questions make perfect sense, the answers are quite complex, particularly, in publicly funded higher education. Consider the STEM education- we have known since eighties that we are not doing as well as other nations but 30+ years later we are still not doing well. Mr. Gates and Microsoft have stated on many occasions that we are not finding home grown talent in STEM areas but higher education has not done much about it. Why?
With respect to using the data as a powerful asset, I could not agree more but what if the data predicts that is not what Presidents and Provosts did not want. Obviously data does not lie and may predict trends that are contrary to their expectations. They decide the “powerful ways” but the data analysis may not support their ways and then what?
Hi Vijendra, you raise an excellent point. What happens if the Presidents and Provosts don’t believe or don’t want to believe the data. I think you will find this article interesting http://www.insidetrack.com/bias-higher-education-mired-inaction/ – it’s equally enlightening and disheartening. However to paraphrase a different President, John F. Kennedy, we choose to do these things not because they are easy, but because they are hard. We can’t give up on this because it is hard. Providing affordable, high quality education and research is too important to ignore.