A common theme across the Higher Education news articles over the past couple of weeks has been about the urgent need for universities to save costs.
A quick peek at any institution’s financial statements will reveal that, not surprisingly, salaries are the biggest single line item. While Pilbara Group will be releasing a newsletter next week that specifically looks at predictive / workload modelling during a financial crisis, I thought that this week we would revisit a series of articles that we released a few years ago on how to investigate whether to ‘Consolidate, Conserve, or Cut’ nominated courses.
The first section looks at one simple report – a report that immediately highlights potential issues with a school or faculty.
The second section takes this a bit deeper and focusses on some simple reports that would help identify those courses that should be further reviewed.
Finally, the last section takes a look at consolidation of courses and how important it is to understand the when, where and how of each course.
Section 1 – How Long is Your Tail?
Every university will teach courses (subjects) that contribute positively to the university’s bottom line. Framed in slightly more business-like language, they are the profitable courses. It is these courses that allow the university to do a range of things that are not necessarily directly funded through external sources, some of which could be:
- build new buildings;
- upgrade technology and systems;
- offer student scholarships and waivers;
And dare we say it…
- subsidise unprofitable courses; and
- enable internally funded research.
In a perfect world, the contribution that each course makes towards the university’s margin (in blue below) would be positive (green).
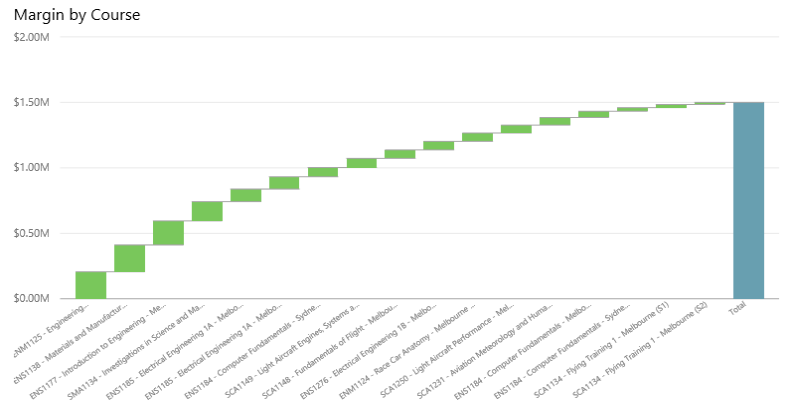
Sadly, this university utopia rarely exists, if ever….in fact, reality is more like this:
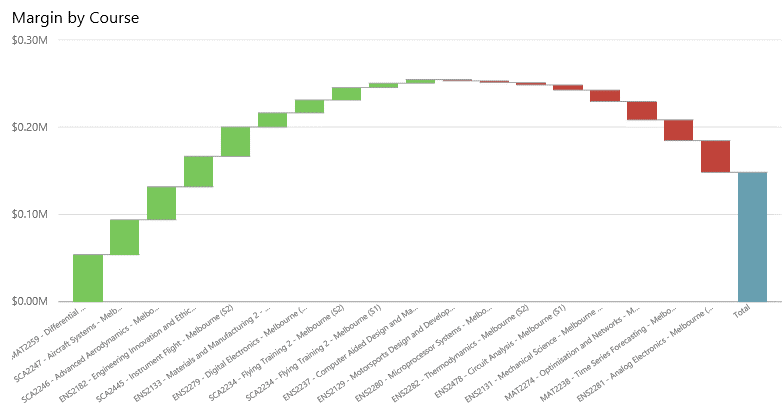
But hopefully not like this! (Although this is probably the situation in many schools due to the current reduction in international students).
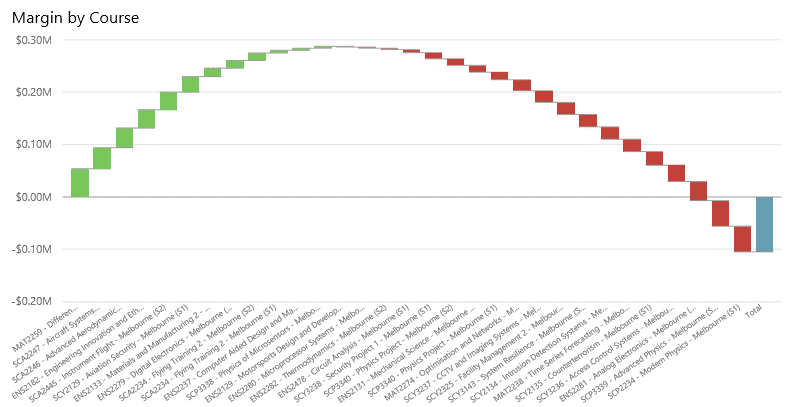
Now margin is just one aspect of a course and it may not be the most important one for each course – there are many other aspects that could be just as important, including quality related metrics such as pass rates, retention statistics, and student satisfaction survey results, etc.
But it can’t be ignored either.
So what does your university, faculty or school’s tail look like?
Knowing the direct revenue and costs of each course isn’t enough to make smart decisions on the future of those courses. To do this, you need to know if each course is covering all of their costs – for example:
- Faculty support costs such as the Dean / General Manager / Finance Manager and so on?
- The cost of the space utilised by each course? Rooms aren’t free….there is depreciation, repairs and maintenance, and utility charges to cover.
- What about the space that your academics and professional staff utilise…offices, conference rooms, kitchens, toilets? Student spaces? Libraries? All of these need to be paid for.
- What about recruitment? Admissions? Career advice? The myriad of other student services?
- Who pays for payroll? IT? Governance? Finance? Marketing?
- Who pays for the Vice Chancellor? The Senior Executive?
And then to make things even more complicated….is your course margin sufficient enough to contribute to the departmentally funded research that your school or faculty is undertaking (and all of the associated overheads that that research consumes)?
And is it helping to subsidise the loss of those strategically important but loss making courses that you must continue to teach?
Obtaining the data to allow you to understand your ‘tail’ is just the beginning of your analytical journey.
Section 2 – Consider, Conserve or Cut?
It is not uncommon for schools to receive pressure to address their low enrolment courses (subjects), and this pressure will no doubt increase during the current COVID-19 crisis. Schools are often told that they shouldn’t be running courses with fewer than, say, 10-20 students in them. Schools often respond with a myriad of reasons as to why any individual course should be maintained, resulting in no further action.
The chances are that a situation similar to this has occurred in the past or will be about to occur within your school or faculty. So how to you go about the process of determining the ‘good’ courses from the ‘bad’ courses? It is not a simple process, nor is it overtly obvious – course analysis is like peeling an onion, there are many layers that need to be looked at before getting to the core of the issue.
Identifying the courses to review
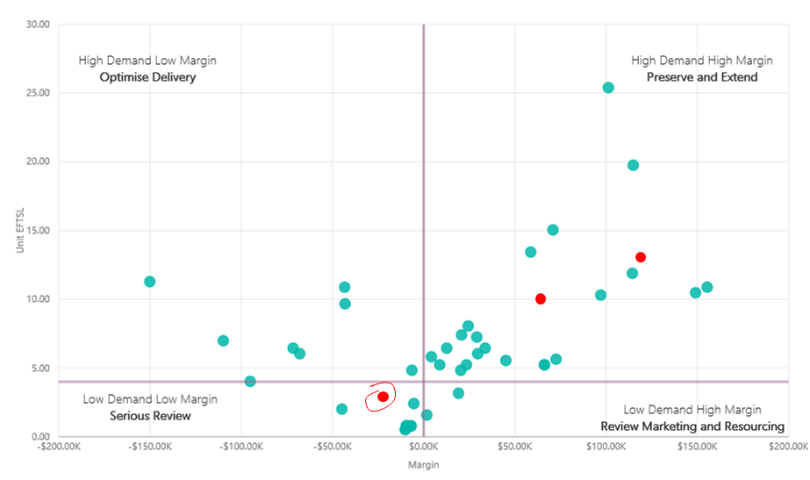
While low enrolment courses are the frequent recipients of these types of reviews they are not always the courses that should actually be addressed. Examining the scatter plot below (enrolment is plotted against the vertical and courses left of this axis are making a loss) we can see there are some large enrolment courses (10-15 EFTSL, or around 80-120 students) that are making significant losses. Reviewing the teaching methodologies for these few courses could have a much higher financial impact than all the low enrolment courses combined.
Returning our attention to the low enrolment courses that are running at a loss. In the plot below the red dots indicate the same course but taught in three different locations or sessions. The circled course may be taught at a new campus for the first time, or taught overseas, or may be required to allow students to fast track their degree by being taught in the summer. So there could be legitimate reasons to retain one or more of these low enrolment instances, especially as the course as a whole is doing well. Conversely, it could be that one instance is dropped while retaining the other two higher load instances of that course (see Section 3 for further details on this).
Is the Course an integral part of a program (or programs)?
Low enrolment courses are frequently highly specialized third or fourth year courses that form a key component of a program. A course may be highlighted as being low enrolment and making a loss if we look at it in isolation, for example:
![]()
But when put in perspective against the program it is supporting, the program as whole looks very healthy.
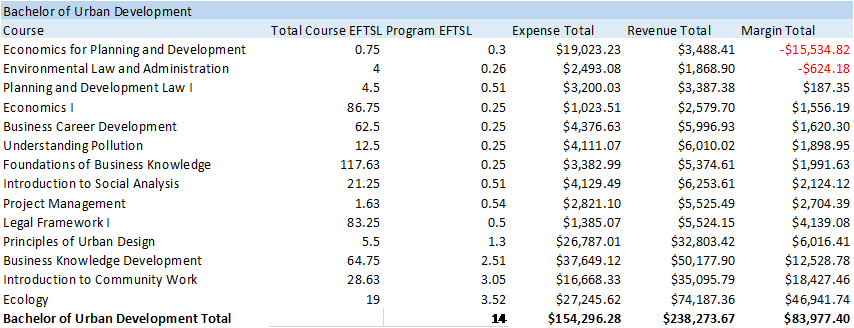
While an individual course may come under scrutiny it is essential to understand the role it is playing in the programs being offered, and what the health of the programs are in their entirety.
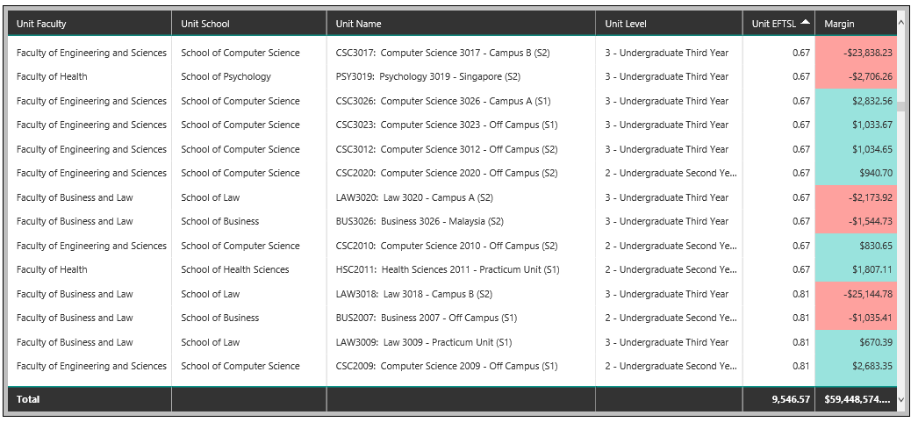
Are the low enrolment courses actually making a loss?
Just because a course has low student numbers it doesn’t mean it is running at a loss. The delivery methods being used have a high impact on the cost base of these courses. The types of students enrolled also have a direct impact on the revenue. Courses with low student numbers CAN be profitable so it does not pay to just draw a line in the sand and blindly assume that they are all no good.
In the review below there are a variety of low enrolment courses with only some of them running at a loss.
What should be considered low enrolment?
This is the hardest one of all to analyse and is where you need to have a detailed and robust cost model to support your decision making process as this is where you need to know the break even point for each course taught. Not only that, but you also need to be able to differentiate direct costs from support costs, and fixed from variable costs.
Based on the simple break even analysis below, it would appear quite simple to make the decision about courses in this particular school or department – anything below 2.5 EFTSL is making a loss and could be strong contender for removal from the course offerings.
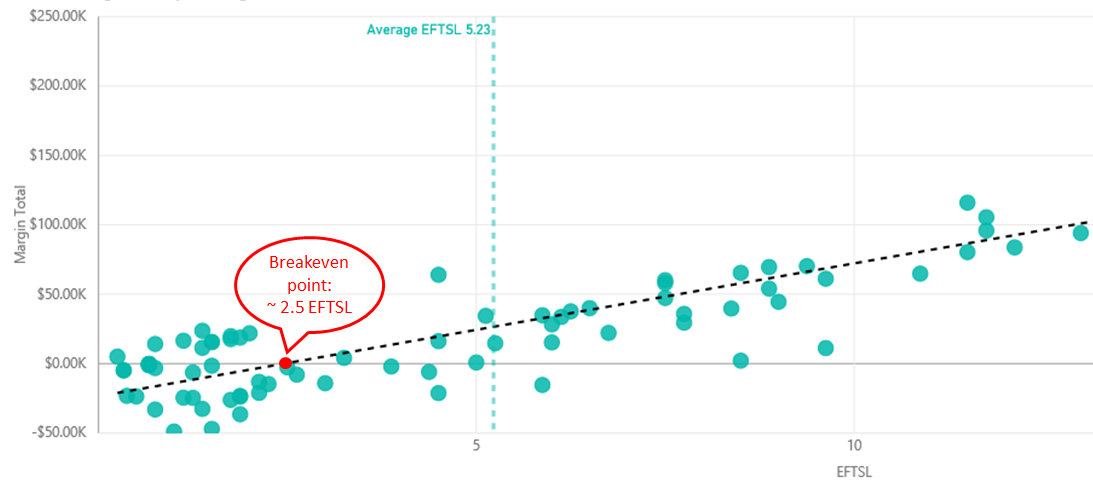
However, a deeper look into these courses is required. Instead of just looking at the margin, both revenue and expense should be analysed separately.
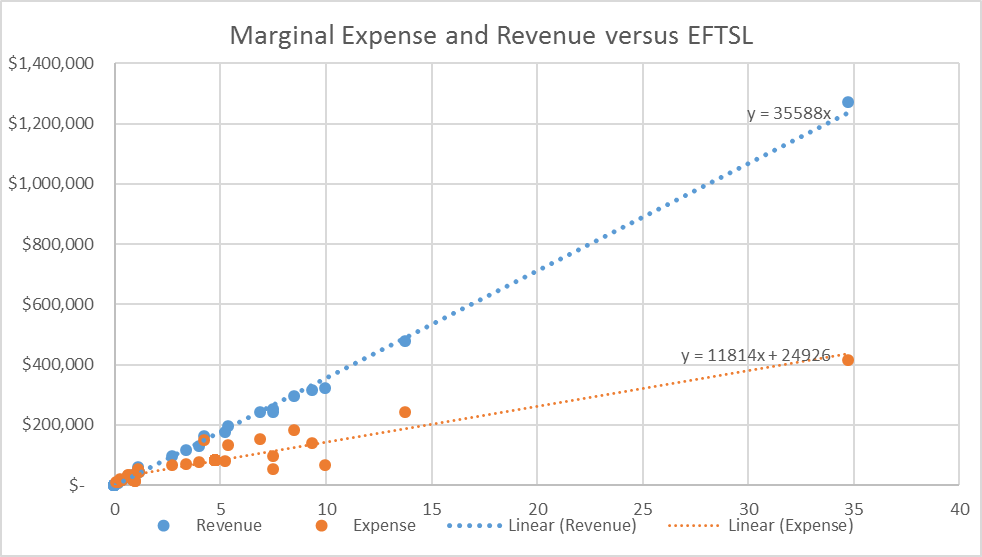
This will give you the revenue per EFTSL ($35,588) and the fixed and variable components of the expenses – $24,926 fixed and $11,814 per EFTSL variable.
So let’s cut to the chase – what does this mean?
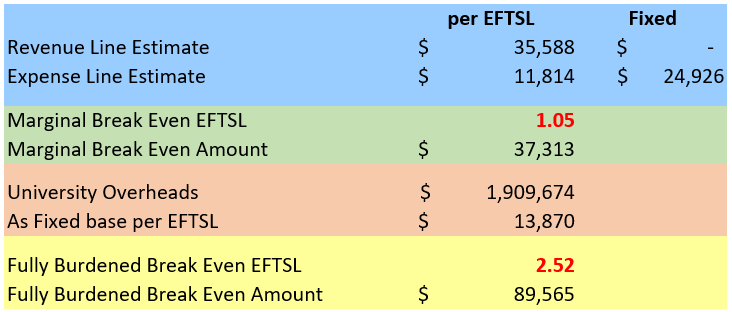
Yes, the fully burdened break even point is approximately 2.5 EFTSL, and yes, you need an average of 2.52 EFTSL in these courses to fully cover all of your costs, including the university overhead.
However, you are covering your direct (school) costs at only 1.05 EFTSL. Therefore courses below 1.05 EFTSL should be seriously reviewed as they aren’t even covering the cost to teach them. But courses with between 1.05 EFTSL and 2.52 EFTSL are covering their direct costs AND contributing towards the nearly $2 million of university overheads that this school consumes.
So what happens if you cease to teach any of these courses? You save on your marginal costs, but your fixed overheads remain the same and now need to be spread out over fewer courses. So you end up losing more in revenue than you save in expenses!
So be aware! A course that is losing money can still be covering its direct costs and contributing towards some of the overheads (just not all of them). Removing these courses without fully understanding their contribution to the overall school bottom line can be very dangerous – you could end up in a worse financial position!
Section 3 – Course Consolidation
Universities provide a range of services to students, both inside and outside of the lecture theatre, to entice, retain, assist and support them throughout their university life. This often includes providing a range of options regarding when, where and how a course (subject) is offered.
Having a cost model that provides you with the margin associated with a course name, whilst being suitable for many things, won’t help you make decisions regarding the when, where and how. As shown below, CSI4364 is making a healthy margin….but it’s not telling you the whole story.
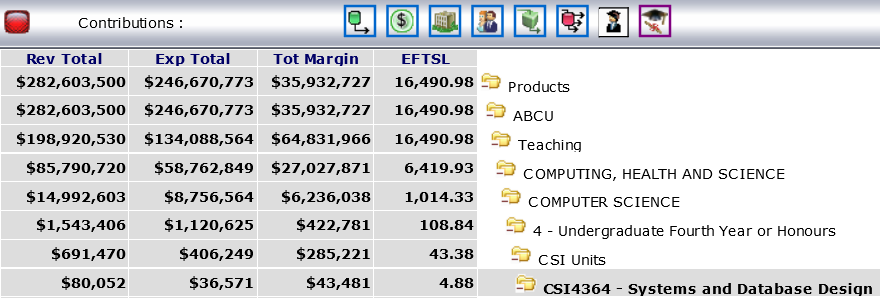
To do this, each course needs to be broken down by the three components making up the when, where and how:
- When: teaching period / semester / term
- Where: campus / location
- How: face to face / online / blended / external
It is not until you can pull apart the cost of delivering a course to this extent that the range of decision options become visible.
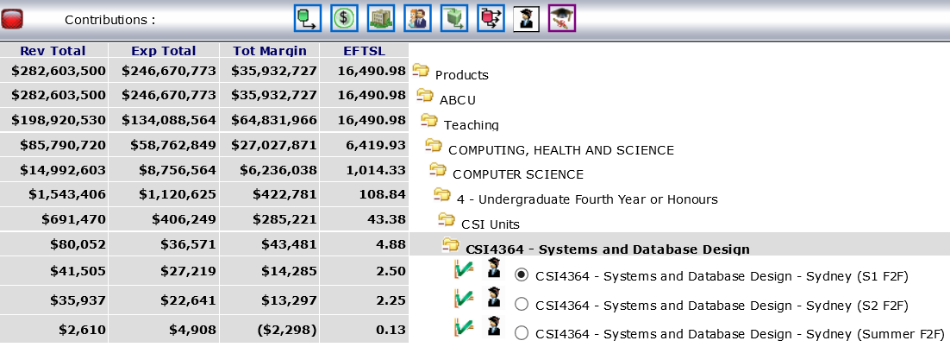
As can be seen above, whilst the course overall is doing well, it is being taught over three separate instances. In this case, they are all in Sydney, all face to face, but being taught in three different sessions – semester 1, semester 2 and summer. The two primary sessions have around 20 students enrolled in each instance and are showing a positive margin. However the course instance being taught over the summer period only has one student (0.125 EFTSL) enrolled in it with the result being that the summer version of this course is making a loss.
So now the cost model is providing you with additional information that can assist in more complex decision making. Is there a specific reason why the course needs to be taught in summer school?
If there is, is there a way to increase enrolments in that instance of the course? Note that cannibalising students from the primary semester sessions isn’t the answer here…no costs will be saved by sharing the same EFTSL load over three sessions. But increasing overall enrolments with specific attention paid to the summer session could be an option.
But if there is no specific reason, then the next phase of the analysis should be looked at. By using your cost model to look at the fixed and variable costs associated with each course instance (broken down by school direct, faculty support and university overhead), you can estimate the savings if:
- the course instance was cancelled and the EFTSL moved to another teaching period (student income retained, redistribution of fixed overheads, some if not all direct teaching costs saved);
- the course instance was cancelled and the EFTSL moved to another course entirely (student income retained, redistribution of fixed overheads, some if not all direct teaching costs saved); or
- the course instance was cancelled and the EFTSL lost to the university (student income lost, redistribution of fixed overheads, some if not all direct teaching costs saved).
Performing this type of analysis on just one course isn’t going to solve your university’s current COVID-19 financial issues, but it is a starting point.
However by understanding your ‘tail’ (as outlined in Section 1) you can firstly identify courses to schools to look at in more depth.
Following this, plotting course margins against EFTSL, as outlined in Section 2, further narrows down the list of courses to review (low EFTSL, low margin). Finally, looking across all instances of each course can help pinpoint, at the lowest level of teaching, individual course instances to be further investigated.
Whilst undertaking this type of analysis should be a priority for universities as a result of the COVID-19 crisis, it should also be done on a regular rolling basis. Reviewing all courses taught by one faculty per year, or conducting a quadrennial course review would assist with ensuring that, in part, the most efficient delivery of teaching is occurring within your institution.
Download the whitepaper outlining additional uses of the model here: www.pilbara.co/whitepaper