The following is a simple example of the type of data that is normally hidden, not purposefully, but rather because it’s simply not captured for easy reporting and analysis. This is from our demonstration model, so it consists of dummy data but is representative of how a university would actually operate.
The Power BI report below (Figure 1) shows the fully burdened cost of courses taught within the School of Architecture and Design. The School Summary graph (upper left-hand corner) shows the revenue, expenses and margin associated with the school’s support of Public Service, Research, and Teaching. The total margin associated with Public Service is -$920k, Research -$940K and Teaching is -$1,090K. The chart in the upper right hand corner of the report shows the total Expenses $17.5 Million, Revenue $14.6 Million and overall margin for the School of Architecture and Design -$2.95 Million. The school teaches a total of 17,356 credit hours using 42.74 FTE of faculty.
The graph in the bottom left hand corner of the report shows just the teaching expenses, revenue, and margins broken down by domestic and global students. The chart in the bottom right hand corner shows the expenses, revenue, and margin broken down by Department. The bar titled School of Arch and Design (third bar) represents the combination of Public Service and Research related activities.
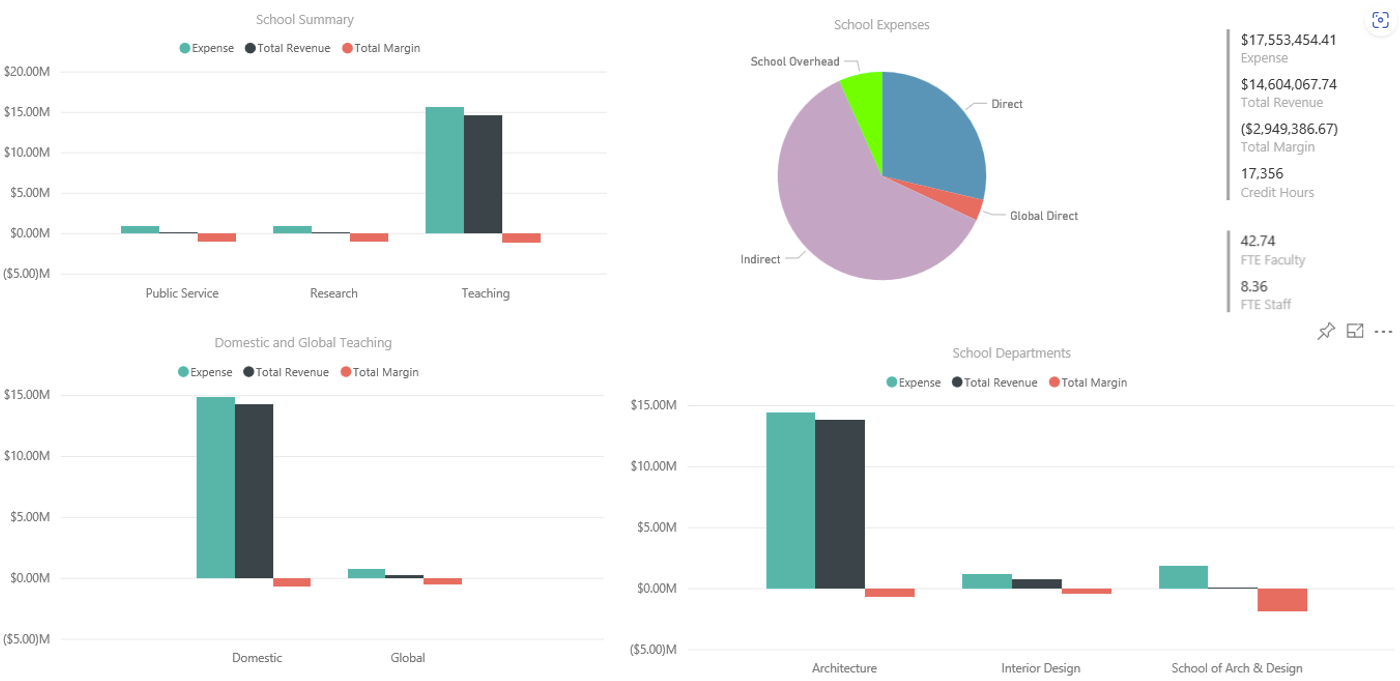
Figure 1
Although the School of Architecture and Design is losing 2.9 million dollars on the courses they teach, you get a slightly different result when you look at the school from a Program viewpoint. In the Power BI report below (Figure 2) the data is based on the courses the students pursuing a degree in the School of Architecture and Design undertook throughout the university. Based on this view the School of Architecture and Design Programs are losing 2.8 million when teaching their own students, however, the College of Arts and Sciences have a positive margin of 1.9 million teaching the School of Architecture and Design students their general education courses. When you examine the School of Architecture and Design from a Program viewpoint they have a negative margin of only $893k. Thus if the decision was made to eliminate the School of Architecture and Design based strictly on the expenses, revenue, and margin depicted in Figure 1 you would not be considering the lost margin associated with those students in the rest of the university.
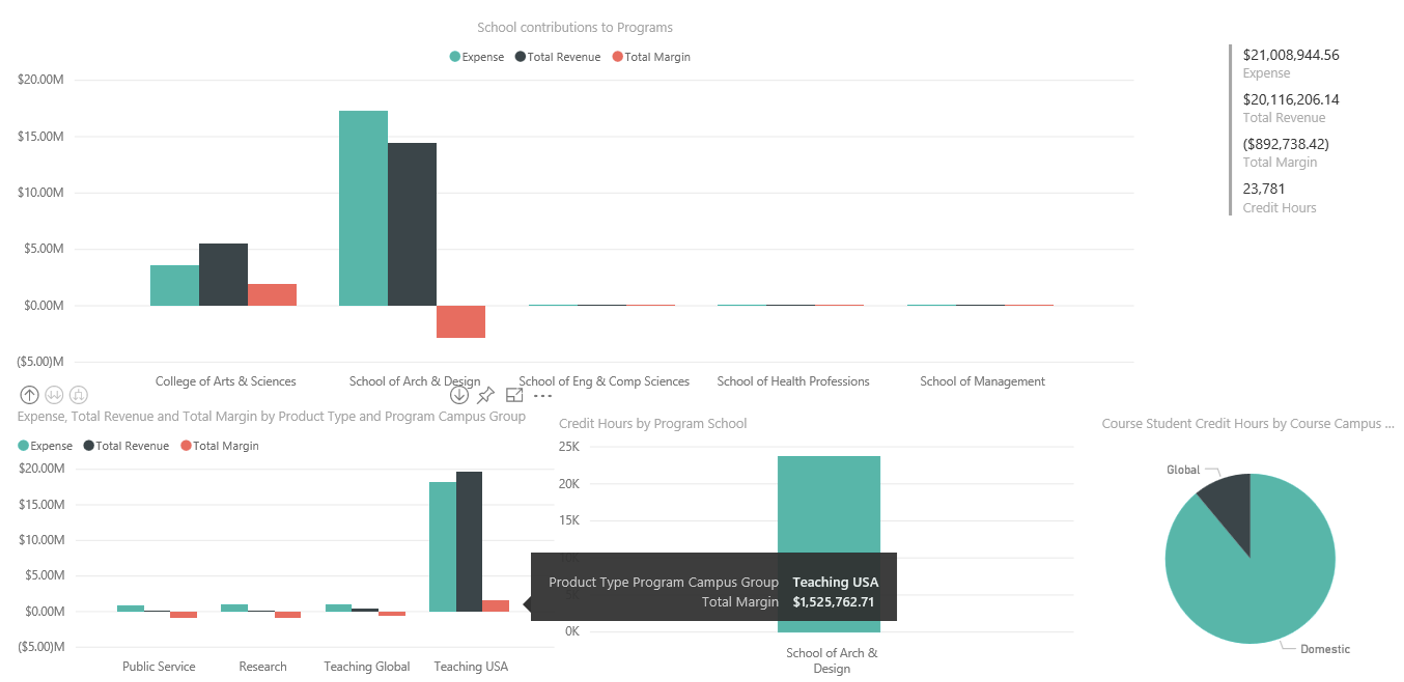
Figure 2
Another important view of the data is to consider the cost of non-teaching activities. In the bottom left hand portion of Figure 2 you will also see the School of Architecture and Design is making a positive margin of $1.5 million on their fully burdened teaching efforts which offsets the majority of their Public Service, Research, and Global campus activities.
Finally, when you filter the Power BI Report (Figure 3) to just display the direct expenses, revenue and margin associated with Public Service, Research, and Teaching within the School of Architecture you obtain a positive margin of $7.9 million which is used to offset the School’s portion of allocated overhead expenses of $10.8 million. If the School of Architecture and Design was eliminated a majority of the university overhead would remain and have to be borne by the other schools.
By using these types of holistic models, Academic decision-makers can start to see the overall university impact of decisions they regularly make inside their schools. Of course, dropping an entire school is a major undertaking, and was used here for illustrative purposes only. This type of analysis can easily be performed down at the Program level as well, to determine which programs to maintain/grow or cut.
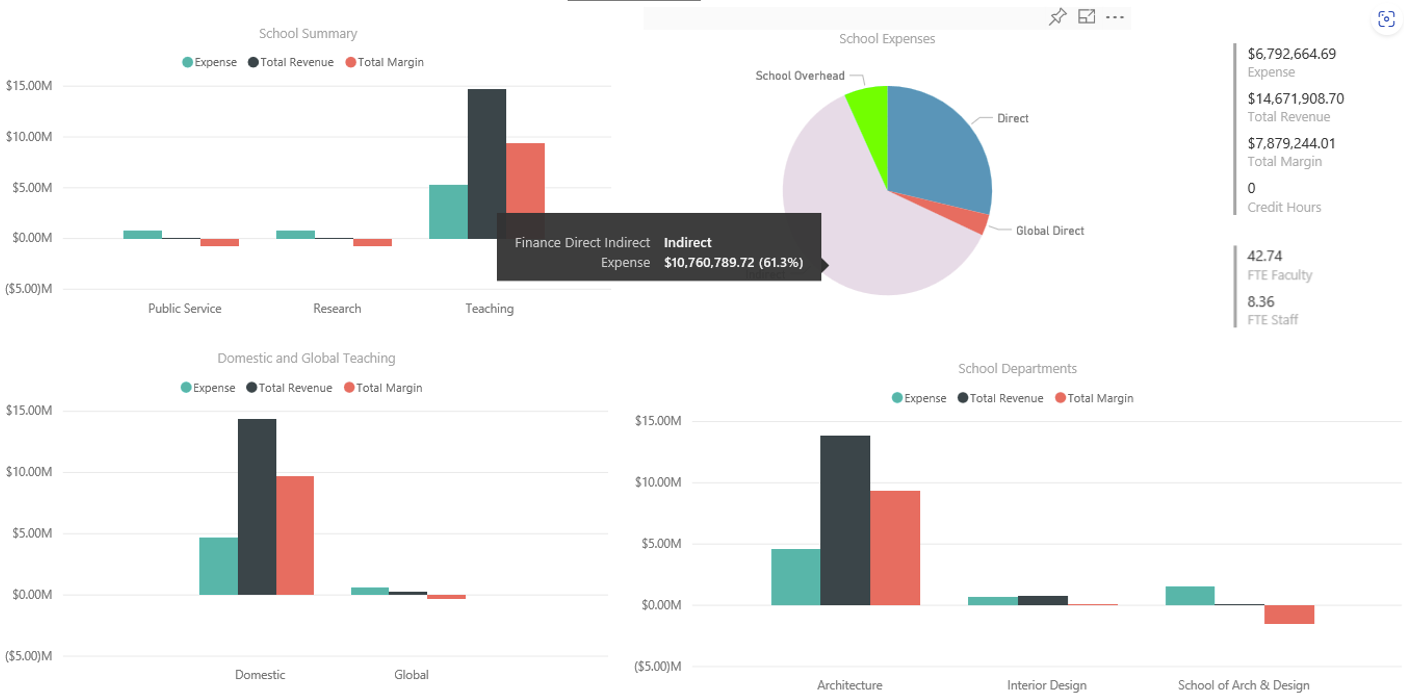
Figure 3