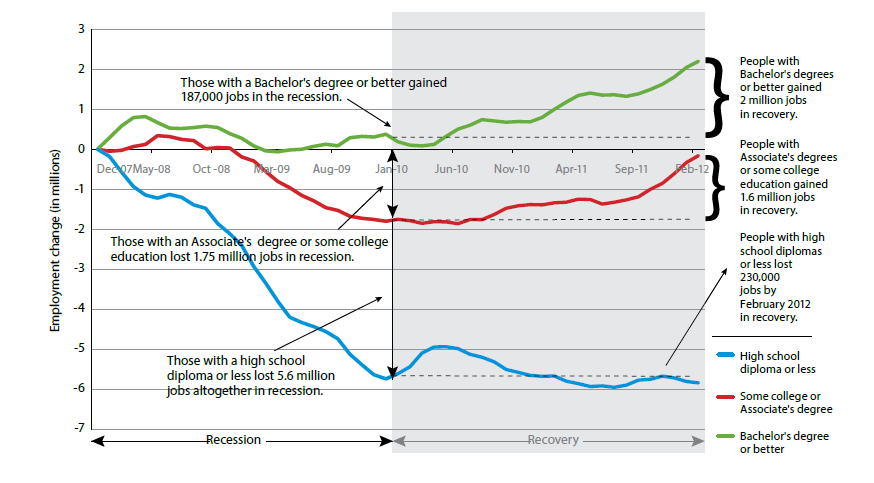
I’ve read a lot lately across a range of topics on higher education and wanted to bring together a number of themes into one post. Let’s start with all the good news. Demand for higher education is increasing and is seen to be important, in a recent survey by Gallup and the Lumina Foundation they found that 72% of Americans think that degree attainment beyond high school is very important, if you add in those who think it is “somewhat important” that increases to 97%, which is a massive percentage. It’s not just public opinion either, a recent report from Georgetown University “The college advantage: Weathering the economic Storm” highlights that those people with a Bachelor’s degree or better gained 2 million jobs in the recovery after the recession, even those with associate degrees or some college gained jobs. The big job losses were those with a high school diploma or less with 230,000 jobs lost by February 2012.
Real demand for higher education is also growing, a Gilfus Research paper indicates that the market for higher education internationally has a Compound Annual Growth Rate (CAGR) of 8% and higher education eLearning has a CAGR of 25%. According to a report by the National Association of State Budget Officers “Improving Post secondary Education Through the Budget Process: Challenges & Opportunities” although the growth rate has slowed down, it is still growing and “between 2000 and 2010 undergraduate enrollment in public institutions grew at a rate more than six times that of K-12.” Now this also means that the growth rate will slow down some more as the number of high school graduates decline, but it is still expected to grow.
On the financial side, a 2012 survey of business officers from 502 institutions by Inside Higher Ed found that a huge 66.3 percent of respondents assessed their financial health as “Good” to “Excellent”, and if you include “fair” it’s a massive 93.8% leaving only 6.2% that think they have poor financials.
Now for the bad news
Moody’s 2013 outlook for higher education is negative, they agree that demand is strong but there are a number of factors that contribute to the negative outlook, namely:
- Price sensitivity continues to suppress net tuition revenue growth (It’s too expensive for most people)
- All non-tuition revenue sources are also strained (Governments aren’t kicking in the same amount any more, endowments are down and research dollars are flat)
- Rising student loan burden and defaults taint perception of value of a college degree (although we saw above that the vast majority of people still value a degree)
- Increased public scrutiny drives escalated risk of more regulation and accreditation sanctions (more administrative overhead for an already strained organization)
- Prospects for long-term sustainability depend upon strong leadership through better governance and management (gotta look at better ways of doing things)
Standards and Poor’s outlook for 2013 is “increasingly volatile” with similar themes to Moody’s – tuition affordability, revenue constraints, increased need for risk management and entrepreneurial thinking. Overall they state that “The constrained operating margins is forcing many institutions to re-evaluate their business models.”
Bain and Company researched the financials of 1,692 universities and found that approximately one-third of colleges and universities are spending more than they can afford, you can find the report and their interactive tool here: http://www.thesustainableuniversity.com/ – if that is representative of all US universities and colleges, that could be well over 1,400 individual institutions that seriously need to review their current business model.
So demand is up, the general population values higher education, revenues are down, costs are rising, Moody’s has a negative outlook, Standard and Poor’s outlook is “increasingly volatile”, Bain and Company have identified at least 33% of universities are not financially sustainable, yet 93.8 percent of business officers report their financials as “fair to excellent”, there is a disconnect here that needs some serious discussion. To be fair 29.9 percent of business officers also think things will be worse financially by 2015.
There are myriad factors at play here, far too many to discuss in this blog post, however the underlying question is “If demand for higher education is growing, why are universities suffering financially?” I can’t answer that question without serious analysis, and a great starting point is a detailed analytical model. The rest of this article will explain at a high level how these models can be constructed so that these types of issues can be analysed properly.
Data-Driven Decision Making
There was a great article on data-driven decision making in Business Officer magazine – the thrust of the article was that finance heads and academic heads need to work collaboratively and use data-driven analytics for strategic decision making. They refer to these solutions as business intelligence, business analytics or performance management however we are going to focus on the concept of the “model” which crosses all three of these solution types.
Analytical Modelling
So what is an analytical modelling? At it’s core it’s a representation of how the university actually works, modelling the intricate relationships between all administration areas and all the different faculty, resources used, revenue raised, all the various types of staff and various types of students, all the buildings, all the courses delivered online or in classrooms – something occuring in one area could impact other areas, there could be cross subsidisation going on, probably undetected, by university management – what is seen as a major revenue raiser could actually be costing more to deliver and slowly bleeding the university. Models need to be built that represent as closely as possible the way the university actually works, not summary level spread sheets, not P&L or Balance Sheets, not traditional business intelligence solutions, not planning and budgeting software. While it is true that analytical models can be developed with a spread sheet, to truly represent university operations these models could have up to and exceeding 2 million individual calculation paths which becomes a huge management and maintenance burden to the analyst. Although, I must say, I’ve seen a number of these massive spread sheets and the analysts do a sterling job of piecing them together and maintaining them, but it’s an enormous amount of work, can easily hide potentially damaging calculation errors and if the organization undergoes a major restructuring the models usually have to be rebuilt from scratch.
Solutions exist now in the market place to enable this type of sophisticated modeling to be developed and maintained a lot easier than the old spread sheet. The methodology for this modeling has been around for many decades, it’s roots are Activity-Based Costing but it has evolved, in fact to a point where Activities are no longer a focal point of the models, rather nowadays they are more driver-based or data-based models. Data is available from a wide-range of sources and this data should be used to build these models to automate them as much as possible.
Steps to building the model.
- Define the scope and boundary of the model – What do you want it for? What is included in the model? What is excluded from the model?
- Identify sources of data – Broad categories include human resources, finance, student management, timetabling, facilities/assets
- Populate the model with all courses and programs
- Populate the model with all financials, assets, HR and general Activities
- Develop the business rules that will determine the way the resources will flow through the model – this is very important and will be discussed in more detail below.
- Assign all individual financial line-items, staff, rooms through to Activities and individual courses and programs
Data-Driven Business Rules
Fundamentally a business rule is a formula that calculates the appropriate amount of cost, revenue, performance or some other value that you are interested in, and distributes it to the appropriate area in the model. It is data-driven because we want the model to automatically calculate specific amounts, and automatically work out where to allocate that amount (known as a calculation path) based on readily available data from a variety of source systems. Back in the old days these paths had to be manually maintained, hence why a lot of old ABC models died or they were made so simplistic that it could easily be built in a standard spreadsheet. It doesn’t have to be that way anymore. These models can be very sophisticated, automated and the more data the better, we put a lot of emphasis on the outputs of the model (rather than the activities) – so the more data we can collect on courses/subjects, research projects, community engagement and sports programs the better. A major caveat to this is the quality of the data, “garbage in garbage out” is still true today, although things are getting better. And if we have holes in our data then we can still build assumptive rules that will find the best paths and allocate costs or revenues based on pre-determined rules.
The following is an example of a real data-driven business rule. A lot of universities don’t have electricity meters on each building, let alone each room – if they do that’s fantastic and we can use that as a more precise data-driven business rule, however if they don’t we can build up a rule from existing data. The business rule for distributing electricity cost through a university is described as follows. “Allocate Electricity Cost from a central campus meter to all buildings in that campus that don’t have a dedicated electricity meter and to each room of those buildings based on the type of the building, the type of the room and the size of the room. The electricity cost allocated to each room is then allocated to each course/subject conducted in that room based on the number of students and type of student enrolled in that course/subject based on timetable and student data.”
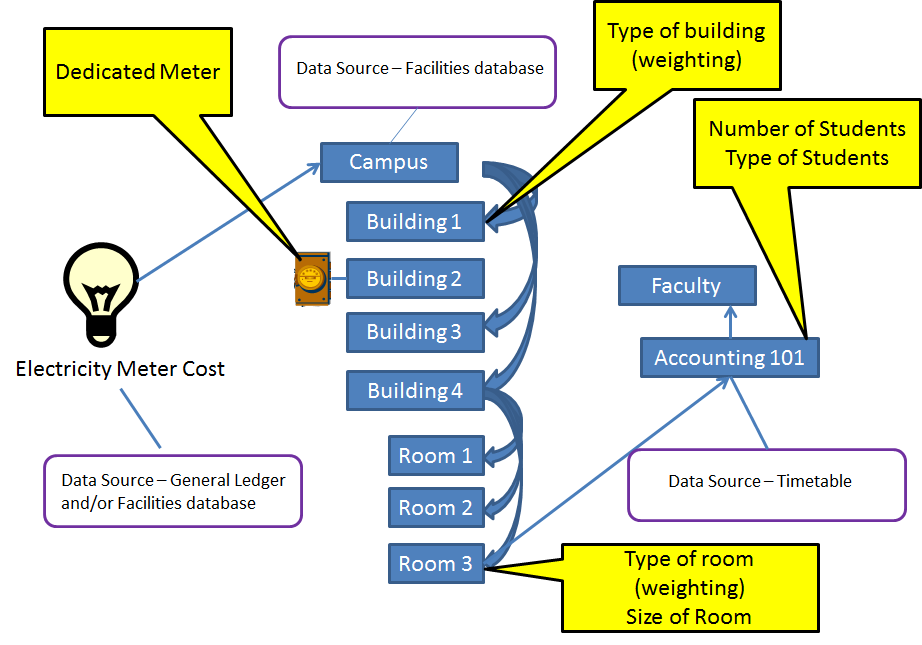
Although this might seem complicated, in practice it is very simple to implement this type of rule in the model.
There will also be a range of other rules, for example, for distributing common space that uses electricity like cafeterias or libraries. Distributing cost by number of students and type of students (on-campus, on-line) might not be equitable, which is a perfect example of why these types of models have to be built with the input and cooperation of the academic community.
The major benefit of creating these types of data-driven business rules is that they adapt to changes in the university, in our simple example above, if you removed a building or changed who used a room, or changed the type of room (updated it to a lab) then the model will automatically adjust. In practice, this is achieved by “refreshing” the model will the new source data, the rule stays the same, this saves an enormous amount of time on model maintenance.
Finance, Academic and Administration Cooperation
As stated in the NACUBO article, it is vital that finance and academics cooperate to build these models. You will also need the input of other areas of administration such as HR, Facilities and IT. Each of these Data-Driven business rules (and there will be many) will require all parties to understand the rule and more importantly the impact on the organisation. It is also recommended that these models be built iteratively, the first run of the model will highlight some of the unintended consequences of some of these business rules, both finance and academics will have to meet to decide the best, and most equitable, solution.
There will always be politics and change management issues to deal with. Our objective is to be as open and as transparent as possible, involve all key stakeholders, encourage robust discussion on the rules and build a model that represents as best as possible the way the university actually operates.
This is just the start of the journey, these models are not one-time models, they are designed to be enduring models, updated on a regular basis and used to create scenarios/”What If” models by changing some of the underlying data and assumptions to see what happens if, for example, there is a 10% drop in international students, 25% drop in State Funding, 30% increase in in-state students etc. You can also use these historical models to inform predictive models, which is the subject of another blog post: http://www.pilbaragroup.com/blog/2013/03/how-the-predictive-model-works/ .
What could the analytical model answer?
- What is the full cost of on-line delivery of courses? How does it compare to classroom based teaching?
- Demand for online courses is rising rapidly, can the university support this growth?
- What is the optimum mix of online and classroom based teaching?
- Is there sufficient cash flow and profitability in future years to allow the necessary capital investment in the future?
- What impact will changed student numbers and type of students in the future years have on the institution’s revenues and corporate and academic staffing levels?
- What is the value of different student types? How do different student types contribute to margins across the institution?
- What are the best performing courses and research projects and what margins do they deliver to the bottom line?
- Are the allocations to faculty of facilities costs and overhead services such as corporate, IT, HR and student services logical, transparent and defensible?
- Is internal cost recovery fair and equitable, or are some areas subsidizing others?
Cost Management
As can be seen above there are quite a few questions that relate to cost. Modelling cost is a significant part of the overall analytical model. There are multiple tools at your disposal when it comes to cost management, there are the standard P&L, Spread Sheet analysis, business intelligence solutions, planning and budgeting applications. All of these solutions have a very real role in university management, there is no “one tool to rule them all” – if you need rapid analysis for the CFO there is no better, or more ubiquitous, tool than the humble spread sheet. Business intelligence solutions are perfect for consolidating large disparate data sets and presenting the results in easy to digest reports and charts, planning and budgeting solutions speak for themselves, P&L for statutory reporting – all are important – the issue is that all of these are also used in some degree to try and manage costs, when in fact a specialist tool exists that can happily coexist with all of these other tools, the cost model.
Cost models form part of the analytical model, I sometimes refer to the analytical model as a cost model, but the simple fact that the model can easily contain revenue makes it more of a financial model, then you could add in performance measures or environmental measures (like CO2 equivalents for electricity/gas consumption) so the overall model is more than cost, but cost is a major component on the model.
Glenn Reynolds, a professor of law at the University of Tennessee, stated in a recent article Popping the Higher Education Bubble – “Schools that get costs under control will have a huge advantage. Those that don’t, will suffer.”
For a broader discussion on Cost Containment at universities, William F. Macy (professor emeritus and former vice-president for business and finance at Stanford University) has written an excellent article Initiatives for containing the cost of higher education where he describes 12 broad areas of best practice for campus lead productivity improvement including:
- Course Redesign
- Advanced Technology Applications
- Learning Metrics
- Resource utilization models
- Activity-Based Costing
- Public disclosure of learning metrics
The full list can be accessed at the link provided above. He also suggests 10 initiatives that can be undertaken by governments, foundations and system wide administrators to spur campus-lead adoption. He makes an excellent observation that it requires a collaborative approach between policy makers and campuses to address these issues properly.
Conclusion
The great news is that demand for higher education is growing, people want and understand the significant benefits of higher education. However, this is a time of change, things are quite volatile, it’s a new marketplace, new competitors all vying for the same pool of students. It’s no longer local competition either, things are becoming more international and online courses mean people can study anywhere in the world, whenever they want. Costs are rising, government support is declining, credit agencies and business officers think things are just going to get worse.
With so many variables, now is the best time to develop data-driven analytical models to support strategic decision making. Strong leadership is required to effectively navigate a safe passage through these stormy seas. But it is essential that senior management are well informed and fully understand the impact on the university of their strategic decisions, so that as demand does rise, universities will know where to position themselves and best approaches to take to properly capitalize on this growth and ensure financial sustainability.
The provocative question that you asked above has been answered with regard to Pennsylvania, if not the entire U.S., in a forthcoming book of mine entitled Privatization Without a Plan: A Failure of Leadership in Pennsylvania Higher Education. The privatization (i.e., rapid defunding by states)of public higher education in America is driven by the demographic changes that have been occurring in the last 60 years or so. The percentage of households with at least one person 18 years of age or younger living there fell from a majority in 1950, to a minority of 34% in 2000, and to 30% as of the most recent 2010 U.S. Census. That means that the vast majority (70%) of the voting households in America today cannot benefit directly from public higher education and, it is quite certain, the people living there don’t want their taxes raised to send someone else’s son or daughter to college. The State budget data in Pennsylvania for the past 20 years show that public higher education funding fell by 57% (from 7% to 3% of the state budget), while higher priorities such as Corrections saw a 50% increase (from 2% to 3%), and Medicaid saw a staggering 167% increase (from 12% to 32%). This is what happens in a republic based on majority rule. At this time in American history, the percentage of the population desiring support for public higher education is a rapidly shrinking minority, meaning that a totally new paradigm for the funding of “public” higher education is desperately needed.
When management of Pennsylvania HEC is fail I think the privatization of public HEC in USA is determined by the demographic changes that have been happening in the last few years and its great achievement of US higher education commission .