How To Manage Program Review
Without the Mother of All Spreadsheets
You know what it’s like, one of your schools is doing a review of their academic programs which includes reviews of curriculum, enrolment trends, quality, capacity of assigned faculty etc. It’s now your job to provide the financial details of the programs under review, which means calculating the costs and margins of each program.
It’s no easy task
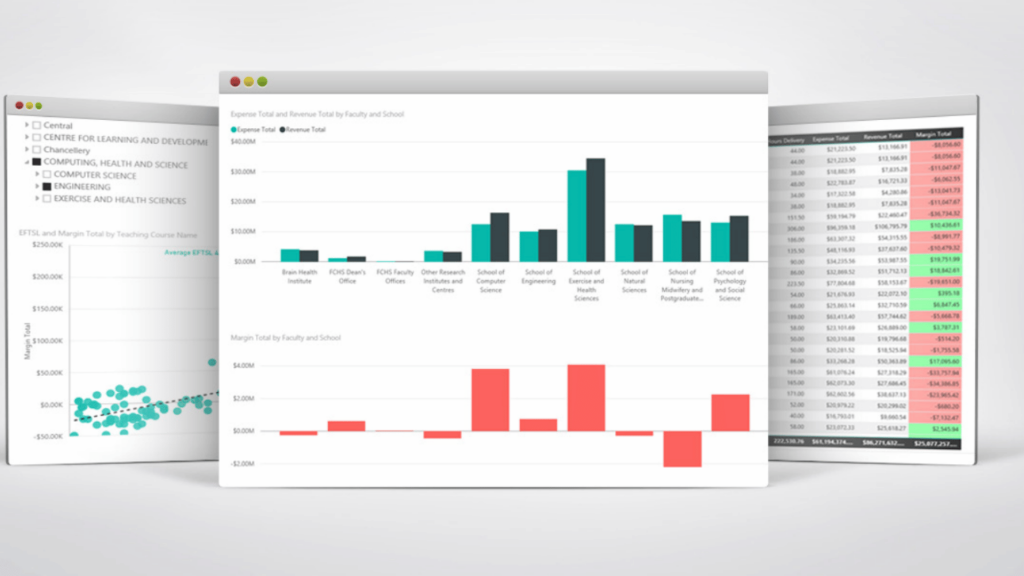
These institutions found a better way with Pilbara Insights


Are you using your team’s time efficiently? If you have to…

Find all the data from the financial management system,
and the payroll data of all the people involved in delivering the programs, which means finding who teaches which courses/subjects and which programs they belong to. You could just focus on the direct costs, but you want to estimate the full cost, so you look at overhead and work out some way of allocating this overhead to these specific programs.
Then you get the call from a different school to review a whole bunch of different programs
and you start the data collection process and calculating from scratch, which is a major burden.
You think to yourself, it would be great if I had all these costs already calculated for all programs for the entire institution in advance, so you don’t have to repeat all of this analysis each time you are asked for cost and margin data for each academic program.


The problem you hit immediately is the shear amount of data that needs to be included for the entire institution,
just for direct costs. The spreadsheet quickly maxes out, it can only handle about one million rows of data and your quick assessment means that you will need 10x that for all direct costs and maybe 100x that to include all overhead.
What if we could do it all for you?
You provide the raw data, then we can prepare the data, model the data, build the reports and make it available in as little as seven weeks and then this model is available any time you require cost information for any program or indeed all the way down to an individual course/subject instance (when, where and how it’s taught).
Are institutions using these types of models for
Program Review now? They sure are!
Academic Program Review is the number one use of these models.
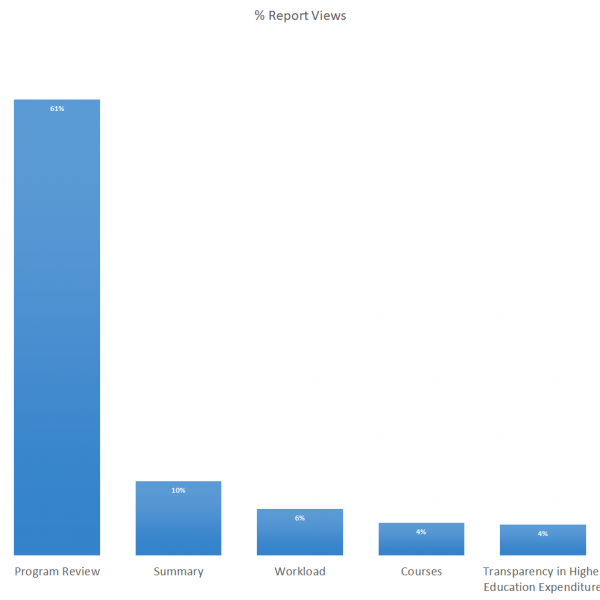
To understand why we asked the universities themselves, they said it’s impossible to do Program Review properly in spreadsheets. This is due to the many-to-many relationships between courses and programs, coupled with the large amount of data from multiple source systems including finance, HR, payroll, facilities management, timetabling and student management. This creates a massive number of calculation paths, easily requiring 10’s of millions and even over 100 million rows of data and Excel can only handle around 1 million rows.
What are some of the Pilbara Insights reports you access through the Power BI interface?
Program Overview
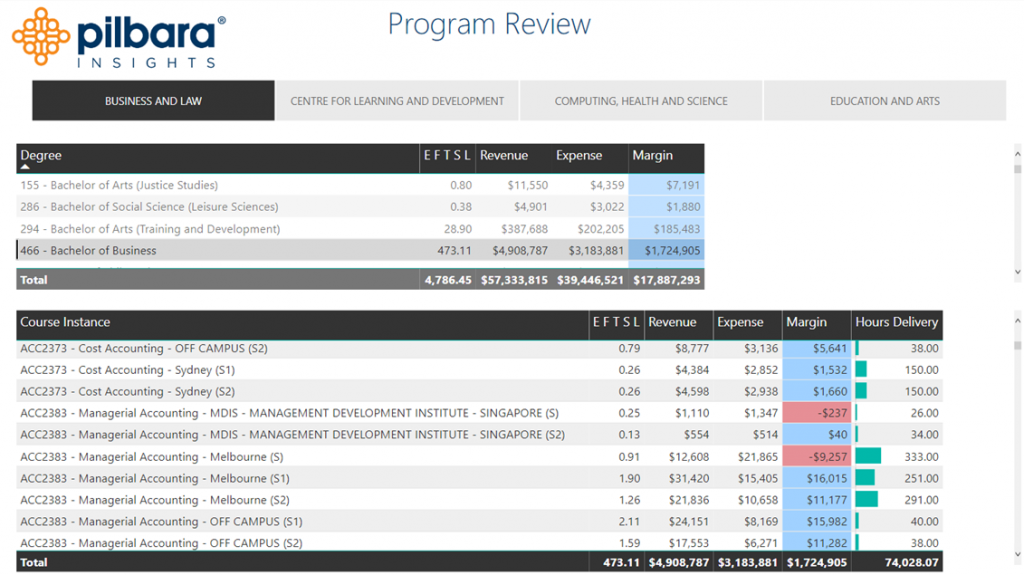
Program reports generally include revenue, expense, margin, EFTSL (or student FTE / student credit hours in US/Canada), delivery hours, staff FTE, program to course relationships.
In this report example, the relationships between programs and courses can be easily interrogated. A specific program can be selected and all of the associated courses will be filtered below and vice-versa, an individual course can be selected and all of the associated programs will be displayed above it.
Sample report
Program Review – Owned Vs Taught
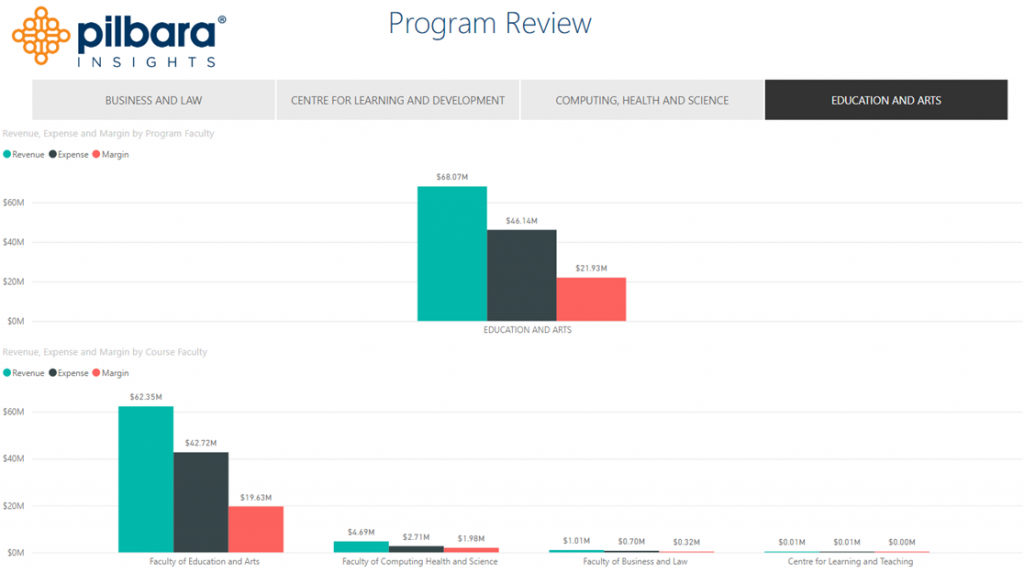
Owned vs Taught is quite a common report as well, it highlights the actual financial cross-over between schools / faculties, this covers situations where engineering students have to take english classes. In this example both the Faculty of Computing Health and Science and the Faculty of Business and Law are contributing positive margin to the Faulty of Education and Arts.
Sample report
Program Review – Owned Vs Taught (Detailed)
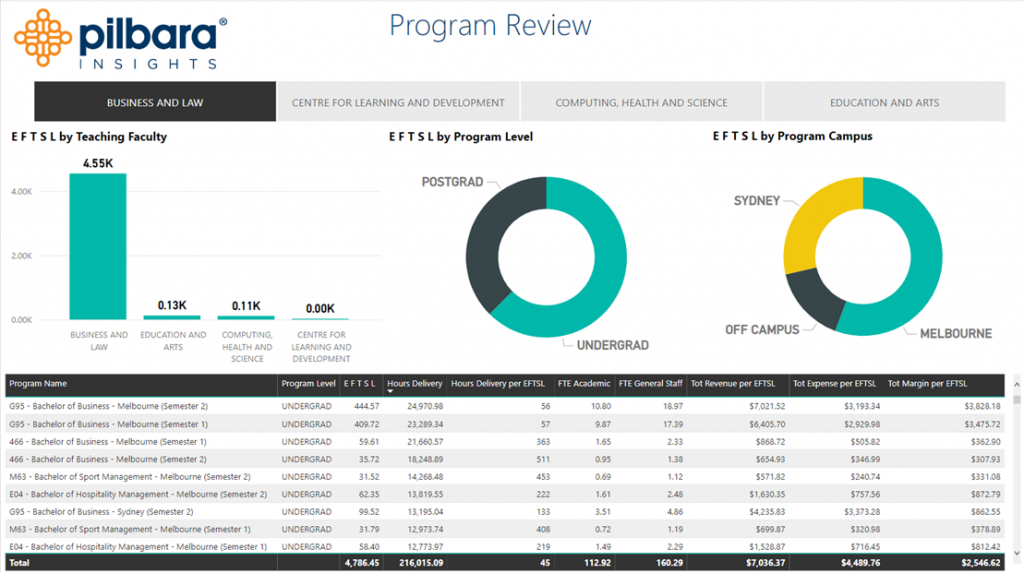
By going to a deeper level, Owned vs Taught can be assessed at the individual program level as well. Here we can see all of the programs owned by the Faculty of Business and Law and a break down of where individual courses are taught at different schools by EFTSL (Student FTE), plus all of the specific details associated with every program. The data can also be viewed by a wide-range of various dimensions including, in this example, Program Level and Program Campus.
Sample report
Learn more in our 3-minute walkthrough video on the Academic Program Review process
What are the opportunity costs of using a spreadsheet system?
