I can’t believe it has been nearly 10 years since this I wrote this article and that very little has changed with respect to my top 3 costing ‘must haves’!
The article has been refreshed where needed and due to changes in technology, I’ve added a 4th point….so welcome to my ‘Top 4 Costing Requirements’.
_____________________________________________________________________________
I did some work for a client a while ago that was a little unusual in today’s world of technology, internet and the need to do things ‘now, now, now’.
Like the majority of our clients, this one was looking at developing an activity based costing (ABC) model. But unlike most of our clients, they wanted to start with training. Not training on how to use ABC software but basic training on what ABC was, what it could be used for, and most refreshing of all to me, what type of functionality and methodology should they pursue in their software platform to get the results that they were after. So basically the ABCs of ABC!
I’ve been designing, implementing and maintaining ABC models for nearly 25 years and one of the more common trends that I’ve seen is that a lot of organisations tend to procure their software first and then try and ‘mash’ their requirements into the functionality that the software provides. While a good proportion of organisations ‘list’ their software requirements in a RFP/RFT or similar, most of these requirements are quite generic in nature and unless the author(s) of the RFP/RFT are aware of some of the more sophisticated and complex functionality out there, they may not realise just what an impact a few of these may have on results that can be obtained from their finished model.
So back to the training I ran. After a full day of workshopping their requirements and obtaining a better understanding of what they actually wanted, I ended up recommending Microsoft Excel. Why? They were small (both in budget and in personnel), this was their first attempt at ABC, and they wanted something simple. And most importantly of all, they knew that their model would evolve once they started to see the results, therefore they didn’t want to be locked into software that may not satisfy their future requirements as their model methodology matured and grew more complex.
As part of the workshop that day, the client and I briefly spoke about my views on the top three ‘must haves’ when looking at procuring activity based costing software. So here they are, in no particular order – because I think they are equally essential ![]() :
:
- the ability to report on not only the beginning and end of your model (the inputs and outputs), but all stages in-between;
- the ability to track multiple cost types through the model; and
- the ability to automate as much of the model allocation and maintenance as possible.
And due to changes in technology over the past 10 years, I’ve now also added a fourth point:
- being able to link your model to not only Microsoft Excel but also to software that provides visual analytics with intuitive report creation.
Must Have #1:
So why I have listed reporting, and more specifically, being able to report on all stages of your model as one of my top three ‘must haves’? Well, I think it’s quite logical – why build a complex model that has numerous allocations in it, each representing phases or stages in your business if you can only report on the beginning and end, and maybe a couple of points in the middle.
Let me give you an example: most typical ‘top –down’ ABC models (as opposed to standard cost ‘bottom up’ models) will involve an extract of the general ledger for a given period (month, quarter, year etc).
However, depending on the size of your organisation, you may wish to then allocate employee related expenditure through to personnel or positions (which in turn gets allocated through to activities) and depreciation through to assets.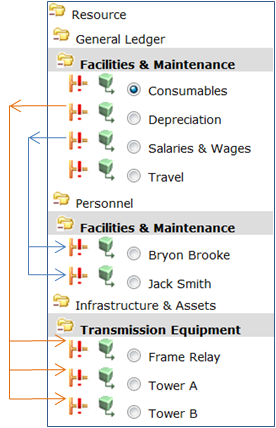
Because some software products restrict you to three modules (Resources, Activities and Cost Objects (Products / Services etc)), you would be required to maintain a number of ‘resource’ structures within your resource module as shown here:
You would then need to allocate salaries and wages to personnel objects and depreciation to asset objects, all within the one module.
Technically this works well – your costs are flowing through the model and will continue on to the next stage of activities. But there are a number of limitations to this type of solution:
- What happens if you want to allocate facilities maintenance activities to the assets and have that cost ‘follow’ the asset cost through the model? Very few ABC software products allow you to send costs backwards from the activity module to the resources module and even if it does, there are normally issues with reciprocal allocations being resolved properly.
- What happens if you want to allocate other GL costs to your personnel using their respective salary costs as the driver? Some software products allow you to ‘phase’ or ‘sequence’ your drivers, but even if they do, you wouldn’t be able to report on salary costs by personnel as nearly all software restricts reporting by module to ‘Start Process’ costs (that is, the starting cost of each object prior to allocations or the ‘End Process’ costs (that is, the finishing cost of each object). In this instance, you would be after the ‘mid point’ cost for personnel, that is, the cost after the first phase of allocations, but prior to the second phase.
- What happens if you want some users to be able to view the General Ledger component but not the Personnel allocations (due to privacy concerns)? In this case, users would have access to the entire module and would be able to see everything.
- And let’s look at the other end of the model. What happens if you want to cost both products and customers? Or services and customers? The same limitations apply. Although it may be possible to do these in just one module, it really limits the reporting available to you.
My solution? Insist on software that enables you to have as many modules as you want – it will provide you with the utmost flexibility from both a modeling point of view as well as a reporting point of view. So, using the example above, this would be how I would set up my model:
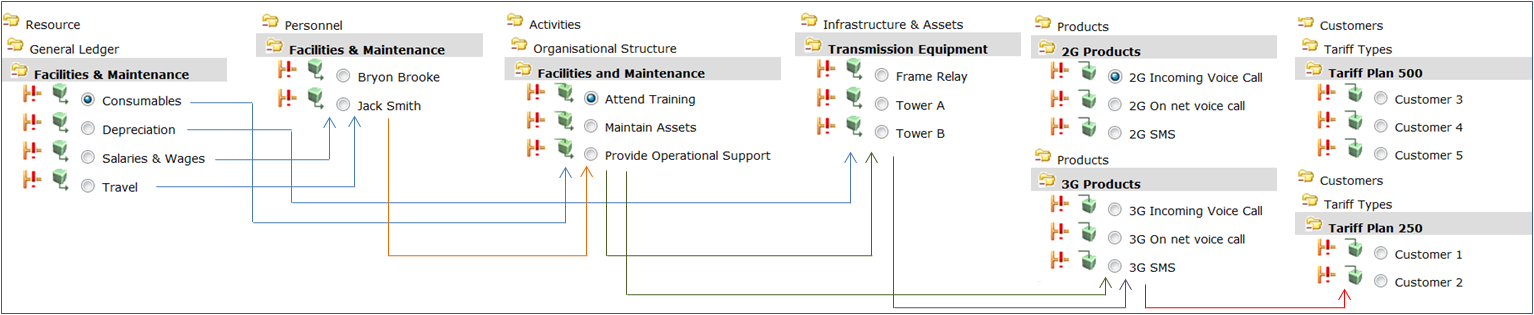
Alternatively, I could have the assets module as my third module followed by activities – it all comes down to how you plan to allocate your resources and activities.
From a reporting point of view, this structure not only allows me to report on each module separately, but also the specific allocations from that module to the individual products and customers – nothing is hidden or lost in inter-modular allocations.
So, as I mentioned earlier, don’t be constrained by three modules and don’t let the software dictate how your model works. Instead, make sure that the software you select can model your business how you want to see it. For me, unlimited modules are a must!
Must Have #2:
The second of my must haves is the ability to have multiple costs types in your ABC model.
So what do I mean by multiple cost types? Imagine a relatively large model containing around 15,000 general ledger accounts, 3,000 personnel, a few hundred assets, about the same number of activities, around 4,000 products and about 500 services.
Now imagine the types of reports that users would like to get out of this model. Because the model takes advantage of using multiple modules, we can report on each stage of the model separately, so reports can be generated that look at the GL contribution to products, the personnel contribution, the asset contribution, and so on. But if all those resources had the same cost type (“cost”), then we would still have difficulty reporting on the different contributions, say when looking at the Activity to Product report. If you had assigned employee expenses from the GL to Personnel, and then Personnel to Activities, and had also assigned depreciation to Assets and then Assets to Activities, the Activity to Products report would show one big bundle of costs and it would be impossible to differentiate where the costs came from (unless you did separate GL to Activity, Personnel to Activity and Asset to Activity reports).
My solution? Insist on software that enables you to have as many cost types as you need – like having unlimited modules, it will provide you with the utmost flexibility from both a modeling point of view as well as a reporting point of view. So what cost types would I have?
- Expenses
- Revenues (as it is hugely beneficial to be able to report on revenues uniquely from expenses)
- Personnel (both expenses and head count or full time equivalent (FTE), and even breaking down the type of personnel into sub-categories such as permanent, casual, contractors etc)
- Assets (both expense and square metres / feet)
Other options may include:
- Balance sheet costs
- CAPEX
- Alternative asset costs (such as historical costs versus current costs)
You can even have different periods as unique cost types, for example Expenses (2019), Expenses (2020), Budget (2021), and so on.
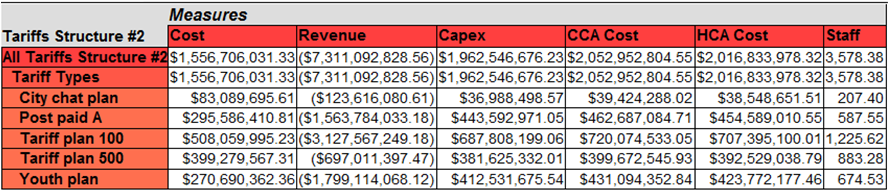
What are the benefits? Your reporting suddenly becomes super easy. Instead of seeing just one ‘total’ cost, you get to see all the unique cost inputs as well as the total cost.
In addition, you can create drivers that are based on unique cost types. For example:
- a CAPEX cost driver that allocates out certain costs to assets or activities based on their consumption of CAPEX (but no other cost type);
- a Revenue cost driver that allocates out certain finance activities to products based on their respective use of revenue; or
- a Personnel Cost driver that allocates out nominated GL costs to activities based on the activities’ use of personnel.
Therefore it doesn’t matter where the cost ends up, by using separate identifiable cost types, you will always be able to see exactly how that cost type has flowed through the model, and not just where it originated.
Must Have #3:
The third must have is being able to maximise model automation and reduce your maintenance burden.
Let’s use the same model that I mentioned above (15,000 general ledger accounts, 3,000 personnel, a few hundred assets, about the same number of activities, around 4,000 products and about 500 services. This model is made up of numerous regions, with both the resources and products spread throughout these locations. As a result, there are activities that are specific to each region.
Things are going well – the model is built and balanced. But wait, it’s time for the first update. It doesn’t matter if your update is monthly, quarterly, or annually, the same issues will arise.
The first step is to import your new GL resources. Anything that is already in the model (i.e. same cost centre and account code) will be allocated as per the original model (assuming the driver isn’t changed). And same with personnel and assets – if they were allocated in the first model, they will remain allocated. But as you can imagine, in a model with over 15,000 GL accounts and 3,000 personnel, new cost centres are created and people come and go (and move internally!). And there are also changes to the 4,000 products – some are removed and new ones are created.
Let’s look at the update process that needs to occur:
- and new cost centres/ account codes need to be allocated through to activities (or personnel if they are employee related expenses, or assets if they are asset-related expenses);
- new assets need to be allocated through to activities, as do new personnel;
- new activities need to be allocated through to products;
- new products need to be added to the current activity allocations; and
- new products need to be allocated to the appropriate services (of which there are around 500).
Assuming that there is a 5% change in your model between periods. That equates to up to 750 GL accounts, 150 personnel, numerous assets, a few dozen activities, up to 250 products and a few services. That equals a massive amount of work to do to update and balance your model.
Let’s take one simple example using a University model as an example. The products are the Units that students take, where they take it, when they take it (which semester) and how they take it. For example, ‘ABC 101’ at Campus X, Semester 1, and Online. So the actual product is ‘ABC 101 (Online:Campus X:Sem 1)’. This is a different product to ‘ABC 101 (Online:Campus Y:Sem 1)’ and ‘ABC 101 (Face-to-Face:Campus X:Sem 2)’ as each of these products attracts different overhead and direct costs.
The activities in the model are pretty standard – there are numerous corporate / overhead activities, direct student-related activities, and of course, the direct teaching and research activities.
If the update process required users to manually update the model, then for each activity, the user would need to review all the products and create the links between that activity and the applicable products.
For example, the activity ‘Provide Student Career Counselling Services’ at the Melbourne Campus would need to be allocated to all Units taught at Melbourne using the 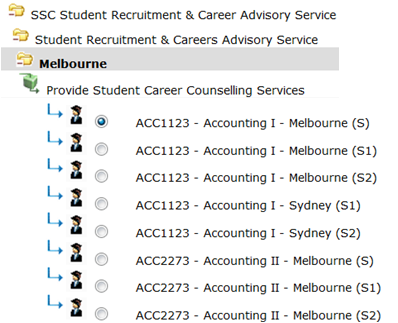 number of students as the cost driver. And the activity ‘Provide Post Graduate Teaching Services’ at Sydney would need to be allocated to all Units taught at Sydney using the number of post-graduate students as the cost driver.
As there could be thousands of Units taught at each campus, the effort required to maintain these links is enormous – not only from a time needed (to complete the task) point of view, but also from a business knowledge point of view – the person doing the updating would need to know which Units to link to each activity.
Multiply the effort required by these two examples into that required for dozens of activities in numerous locations and suddenly the amount of time needed to ‘balance’ the model is massive. It’s not uncommon to hear of businesses updating their model quarterly – four weeks to collect the survey data, and six weeks to balance the model, leaving a mere 2 weeks for analysis before the cycle starts again. The ratio should be reversed – two weeks to update and ten weeks to analyse, investigate and improve.
My solution? Insist on software that enables you to auto-create allocation paths instead of manually having to find and link objects to create them.
Using the same example described above, all the user is required to do is create one ‘path’, that is, they allocate the activity to the ‘Teaching’ structure and then select  the most appropriate driver (in this case it is the number of students on campus (as opposed to those studying online) by Campus (in this case Melbourne), or ‘EFTSL On Campus by Campus’. The ABC software then does all the allocation work for you:
- by allocating the activity to the structure, all Units held under that structure are automatically selected as potential allocation paths, whether there are 10 units or 10,000 units below the Teaching structure; and
- the software then applies filters based on the selected driver – only those Units that have ‘On Campus EFTSL’ and that are located in ‘Melbourne’.
As a result, out of the 4,000 Units found under ‘Teaching’, only those with On Campus EFTSL taught from Melbourne are actually selected by the software as allocation paths. And the best bit? It takes the user 10 seconds to create the allocation path and select the driver, and the software does all the rest…..year on year on year.
But wait…some of you may be asking how did the software select the appropriate Units? The student enrolment data obtained from the university provided a wealth of 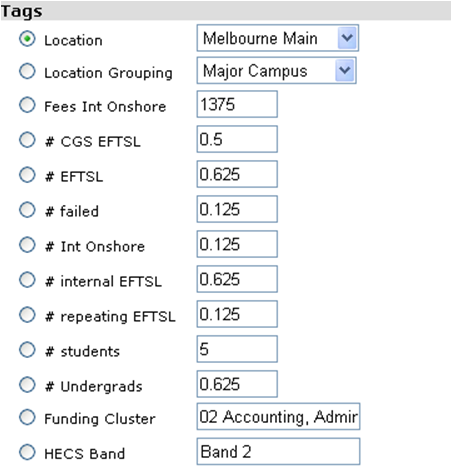 information other than just what the Unit names were. It also provided the number of students taking each Unit, the type of student (Commonwealth funded, domestic fee paying, international etc), the Unit level (undergraduate, postgraduate etc), the location of the Unit (Melbourne, Sydney, Brisbane etc), the fees associated with the Unit (for both funded and fee paying students), plus a range of other information.
All this meta data is loaded against each Unit when the Unit names are imported into the model, and this data, either in isolation (i.e. Melbourne Units) or combined (Postgraduate EFTSL undertaking Melbourne Units Online) can be automatically targeted and used by drivers with virtually no effort by the user to maintain and manage their model.
And the other bonus? All this meta data is automatically used in the OLAP cubes and can be used to filter or customise your final reports.
Which brings me to the 4th and newest must have!
Must Have #4:
The fourth must have is to be able to easily link your model to not only Microsoft Excel but also to software that provides visual analytics with intuitive report creation.
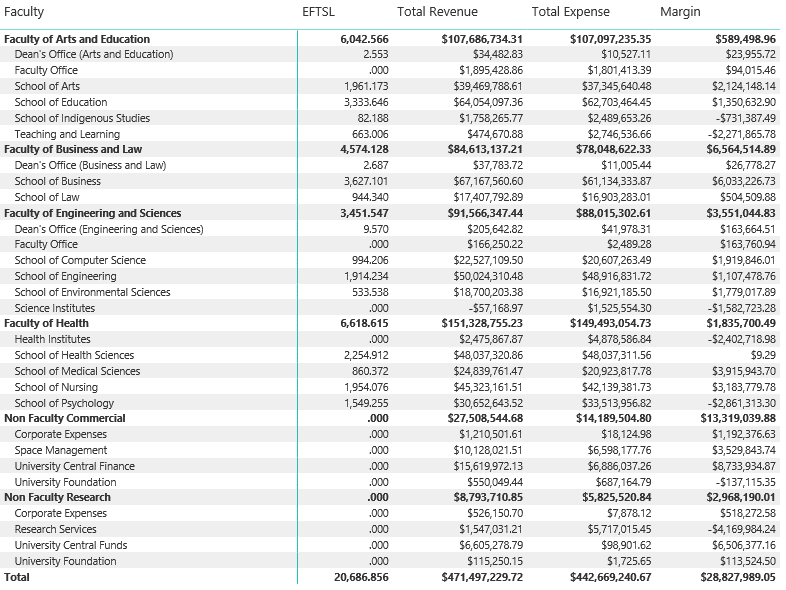
Let’s use the university example above and think about how you would report on something simple such as the revenue / expense / margin of the 4,000 units taught each year.
Even at the highest level (by Faculty and school), there’s quite a bit of data to look through to see if anything immediately stands out.
But now let’s show that same information visually using Microsoft PowerBI:
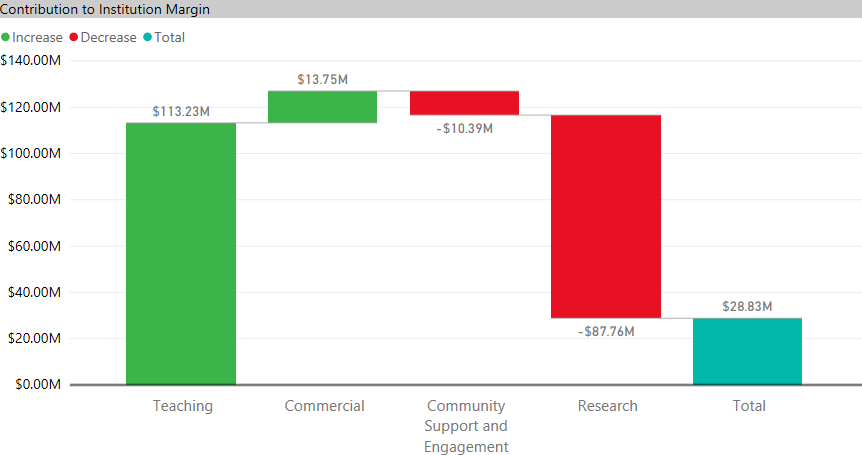
And then start drilling into that visual…let’s look at teaching:
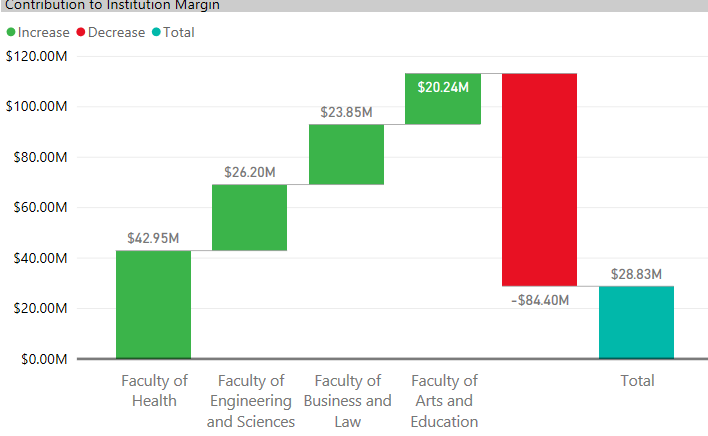
And then drill into the Faculty of Arts:
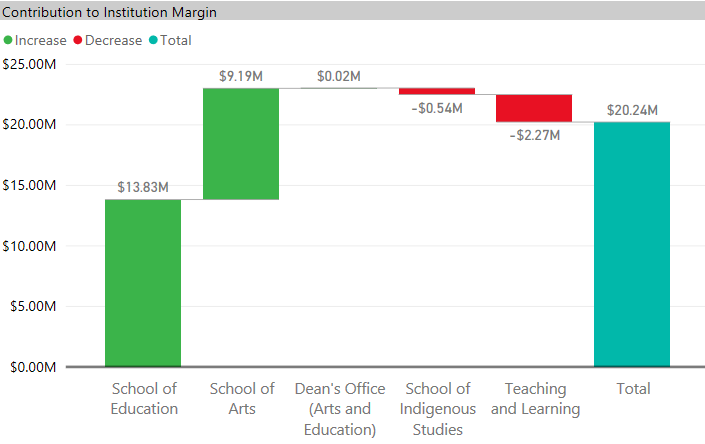
And so on and so on until you get to the subset of data that you want to review:
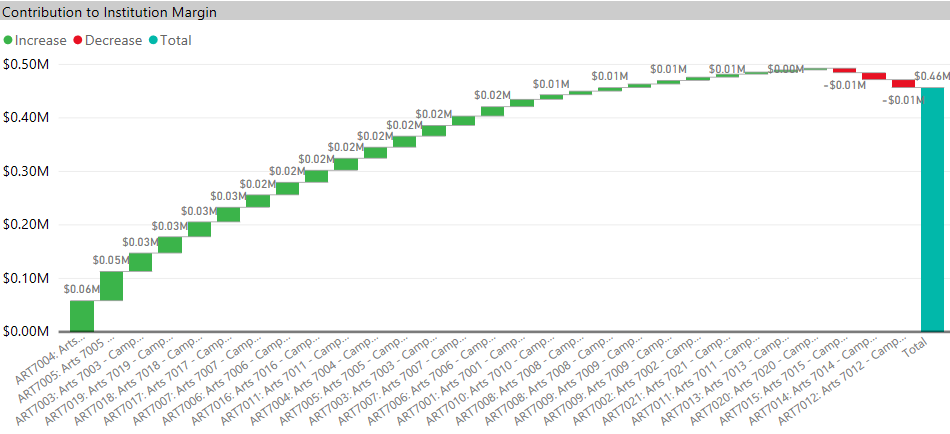
Having the ability to view the data visually makes it so much easier to see trends, outliers, and areas of potential concern – in this case the units Art7015, Art7014 and Art7012 which all make a loss.
So, to summarise…
- don’t be constrained by three modules;
- don’t be restricted to only one cost type;
- ensure you select software that automates the majority of your model maintenance; and
- make sure that your model can be linked with visual analytics software such as PowerBI.
Trust me, these four things will definitely make your model simpler to maintain and easier to report on – things every cost modeller should be seeking!
Excellent article ! I agree 100% as I’m also an ABC specialist here in South Africa. I designed and implemented my Excel ABC model here in South Africa, but I have serious problems over here to find developers to upgrade my model etc.