Following on from knowing your ‘available’ versus ‘required’ academic hours (as outlined in our last newsletter / blog post), the next level of understanding is to apply that knowledge to all the outputs of the school or discipline and not just the teaching component. By understanding the full theoretical output of a school, and then applying the respective workload profiles (be they at the individual or school level) to help distribute academic salary (traditionally the biggest slice of the school’s expenses), Deans and Heads of School will be able to better understand how teaching may be subsidising the research outputs, or in some cases, vice versa.
At a school or discipline level, it can be relatively easy to work out a simple split of direct costs between the two big product sets that a school or discipline produces. However, once you start to factor in any school or faculty support costs (including the service or admin component of the institution’s workload splits), it can become more involved. Adding university-wide costs such as HR, IT and Facilities expenses makes it an all but impossible exercise to rigorously compare the different schools.
Providing a robust mechanism to distribute support and overhead costs down to the individual school products (subjects and degrees on the teaching side and fields and subfields on the research side) is a ‘bread and butter’ feature of a university’s operational cost model.
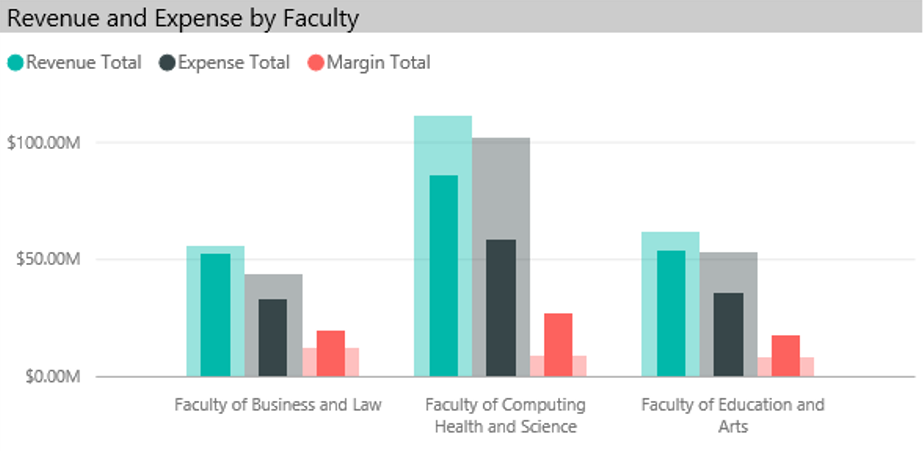
Below we can see the overall margins associated with each faculty, and on the right, the portion of expenses associated with the major product sets of Teaching, Research, Commercial and Community Engagement.

Microsoft Power BI adds further insight by showing how each product set contributes to the overall margin (in red). By allowing you to select a product (in this case ‘teaching’), the revenue, expenses and margin of just that slice of the faculty’s activity is then shown as compared to its overall figures. In the visual below, the solid bars indicate the teaching component, with all three faculties showing a higher margin for teaching (dark red bars) than for overall margin (the lighter red bars).
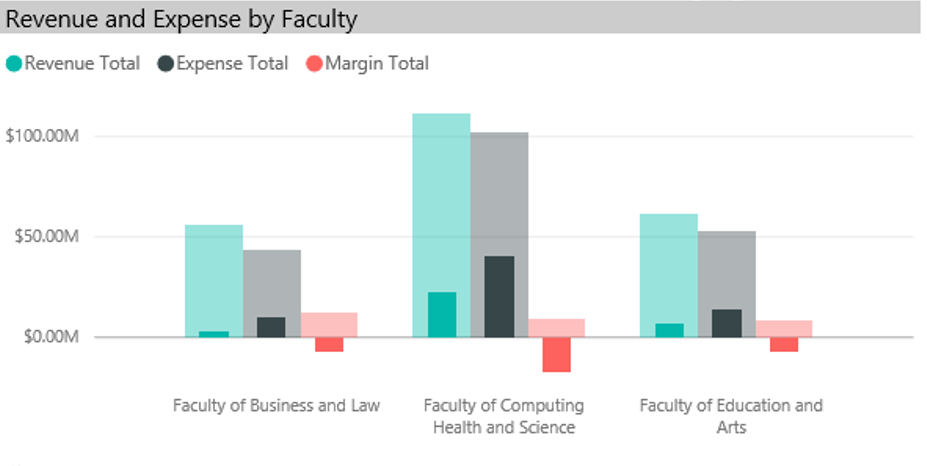
The view looks quite different when ‘research’ is selected. Here you can see how research has a negative margin within each faculty (the solid red bars), with the faculties’ overall margin showing up as the lighter red bars.
If desired, the model can be configured so that HDR Supervision can be isolated as a completely separate ‘product’ enabling it to be viewed as either part of teaching or alternatively or part of research, depending on the user’s requirements.
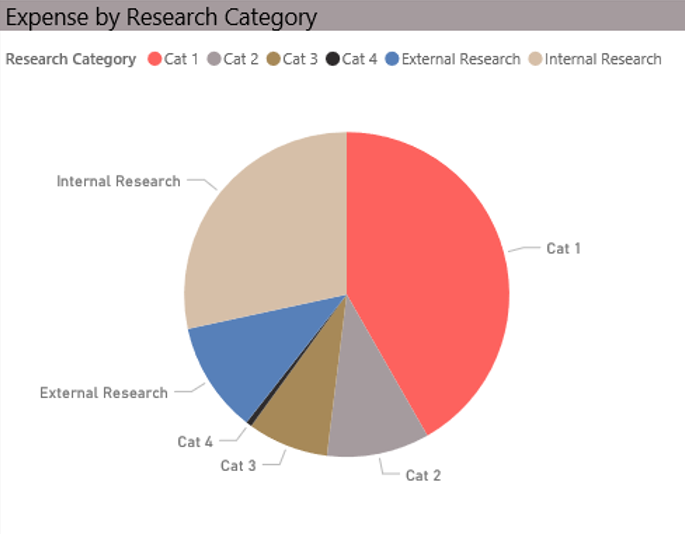
Once you understand the true cost of research within a school or faculty, the next step is to analyze the makeup of this cost. At a minimum, institutions should understand the cost of department (internally funded) research versus that expended on externally funded research. An even better view is one that details what type of research is being undertaken. In Australia, that can be by Research Category (Cat 1, 2, 3 or 4), or by field of research (FoR) / discipline.
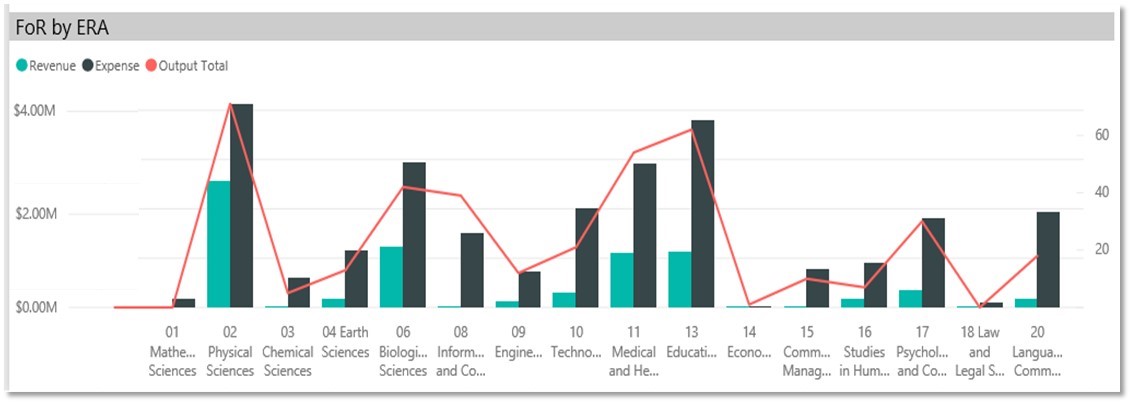
In the graph below, the revenue and expense of each broad field of research is compared with the number of outputs (publications, journal articles etc) attributed to that discipline. One of the things we learned in our interviews is that disparities in this comparison may lead to institutions adjusting their research investment strategies.
Download the full whitepaper here: www.pilbara.co/whitepaper