Your university's cost and margin answers, built for you

We do all the work, from your raw data to working reports. Your leaders see the true cost and margin of every program and course, and move from question to decision in days.

  • Data prep
  • Model build
  • Report build
  • AI set-up
Request a demo

We do all the work. Your team gets the answers.

You provide the raw data. We prepare it, build your university model, build the reports and set up the AI, so your finance team spends its time on decisions instead of spreadsheets.

Data prep

You send the raw extracts. We clean, reconcile and structure your finance and student data, so your team does no data wrangling.

Finance systemCleaned and reconciled
Student management systemCleaned and reconciled
HR, payroll, facilities, timetablingAdd later
Model build

We build your university model from the bottom up, starting with when, where and how each subject is taught, then resolve shared subjects and apply overheads.

Every subject offering
Programs and courses
Schools and faculties
Whole institutionplus overheads, by causal allocation

Report build

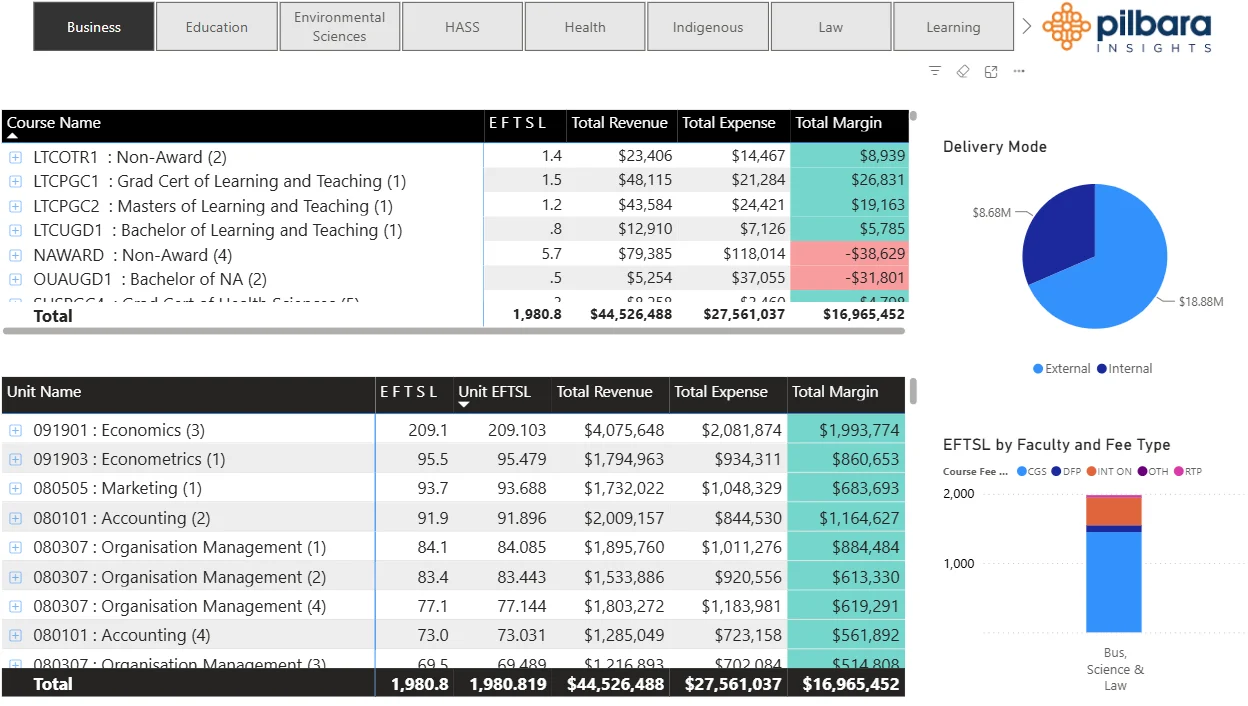
We build the reports your leaders use, showing revenue, cost and margin for every program and course in Pilbara Insights.

Pilbara Insights report listing EFTSL, revenue, expense and margin by course and unit, with delivery mode and EFTSL by fee type charts

AI set-up

We connect Pilbara Intelligence to your model, so your team can ask questions in plain English and get answers grounded in your own data.

Which Academic Programs have the highest margins?
The Diploma of Health Sciences (Domestic) program has the highest net margin at $16.4 million, followed by the Bachelor of Medicine at $14.5 million and Masters of Medicine at $8.7 million...

Answer generated in 31 seconds

Decisions at the speed of leadership

Most universities still answer financial questions the slow way. Because we build your model and keep it ready, the question you ask on Monday has a defensible answer this week, not next budget cycle.

Doing it yourself

  • Cost answers take weeks of manual spreadsheet work
  • Numbers are argued over instead of acted on
  • Decisions wait for the next budget cycle
  • Analysts gather data instead of interpreting it

With Pilbara doing the work

  • Program and course costs available on demand
  • One defensible, agreed source of truth
  • Leaders move from question to decision in days
  • Your team's time goes on analysis and decisions

What we build and run for you

Every engagement delivers working tools your leaders use, with our team behind them.

Pilbara Insights

Stop waiting weeks for answers your CFO needed yesterday

Most financial analysis in higher education is done one program and one request at a time, and each request takes days of data wrangling. We model your whole institution once, so you can assess every program at the same time.

  • True revenue, cost and margin for every program and course
  • See which programs cross-subsidise others, and by how much
  • Reports ready when the CFO or a Dean asks
Explore Pilbara Insights

Time to assess margin across all academic programs

Spreadsheet approach2–4 weeks
Pilbara InsightsMinutes

Why the gap? Spreadsheet teams work program by program, gathering data, reconciling systems and rebuilding models for each request. We build the whole institution once, so the next question is already answered.

Pilbara Benchmarks

Know where you stand before you make a move

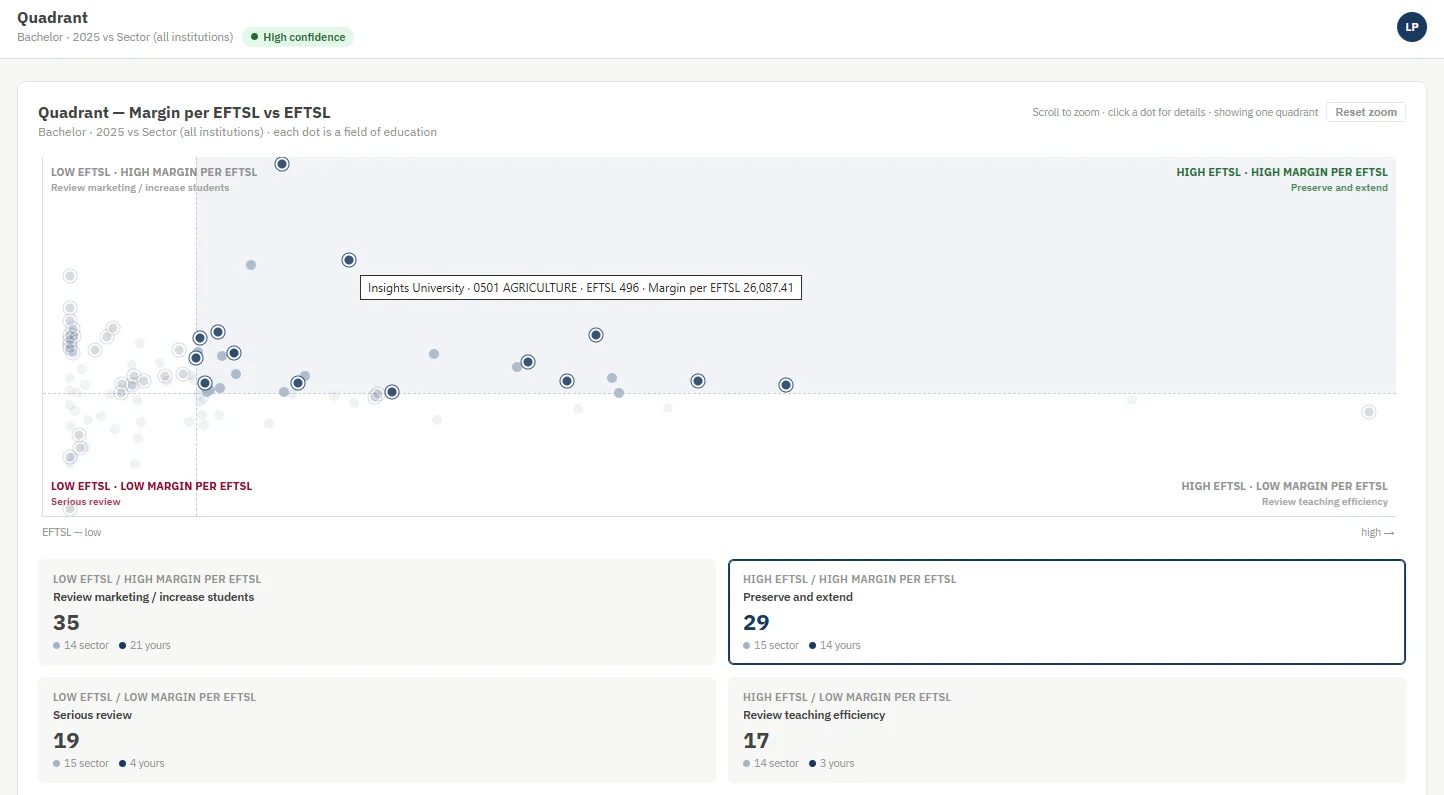
Australian universities can see how each of their disciplines compares with the sector by Field of Education, using cost, revenue and workload data drawn from real university models.

  • Compare disciplines at 2- and 4-digit Field of Education level
  • See where you lead and where to improve
  • A credible external reference point for budget conversations
Explore Pilbara Benchmarks
Pilbara Benchmarks quadrant comparing margin per EFTSL against EFTSL for each field of education, your university against the sector, with counts in each quadrant
Pilbara Intelligence

Ask any question, get an answer in seconds

We connect AI to your own university model. Finance leaders, Deans and planning managers ask questions in plain English and get answers grounded in your data, without waiting for a report or an analyst.

  • Ask about any program, course or scenario
  • Every answer traces back to your model
  • Answers update as your model updates
See it in action
Pilbara Intelligence
What would happen to our surplus if domestic enrolments in Engineering fell 10%?
A 10% fall in domestic Engineering enrolments would reduce the university's surplus by $114,687 (0.14%) from $83.58 million to $83.47 million.

Answer generated in 67 seconds

Our clients use their university models to make smart financial decisions

Logos of Pilbara's higher education clients, including University of Maryland, UC Riverside, Berklee, Australian National University, RMIT, University of Melbourne, University of British Columbia and others
Cynthia R. Hale
“We can actually understand the full cost of our instructional programs…we’ve never had anything close to that kind of information in the past. This is the first time we can honestly understand how much they should cost and how we should resource them. Because this university has worked on a historical budget model for many years, this is revolutionary.”

Cynthia R. Hale

Associate Vice President for Finance and Personnel in the Office of the Senior Vice President and Provost, University of Maryland

Anita Anderson
“Pilbara’s demonstrated higher education sector knowledge has provided CQU with a model derived from granular-level data, whilst also being timely, transparent, accurate and flexible for any future CQU or sector changes. The Pilbara team are always professional and flexible, and in constant contact as to more innovative costing approaches and sector updates.”

Anita Anderson

Deputy Director Corporate Budget, Central Queensland University

Dr Gwilym Croucher
“Understanding what drives cost in higher education is a really fiendish challenge.”

Dr Gwilym Croucher

Researcher at the Melbourne Centre for the Study of Higher Education at the University of Melbourne

Request a Demo

See how fast your institution could be moving. Request a demo and we’ll show you exactly how Pilbara Insights works with your data — so you can walk away knowing what’s possible before you commit to anything.

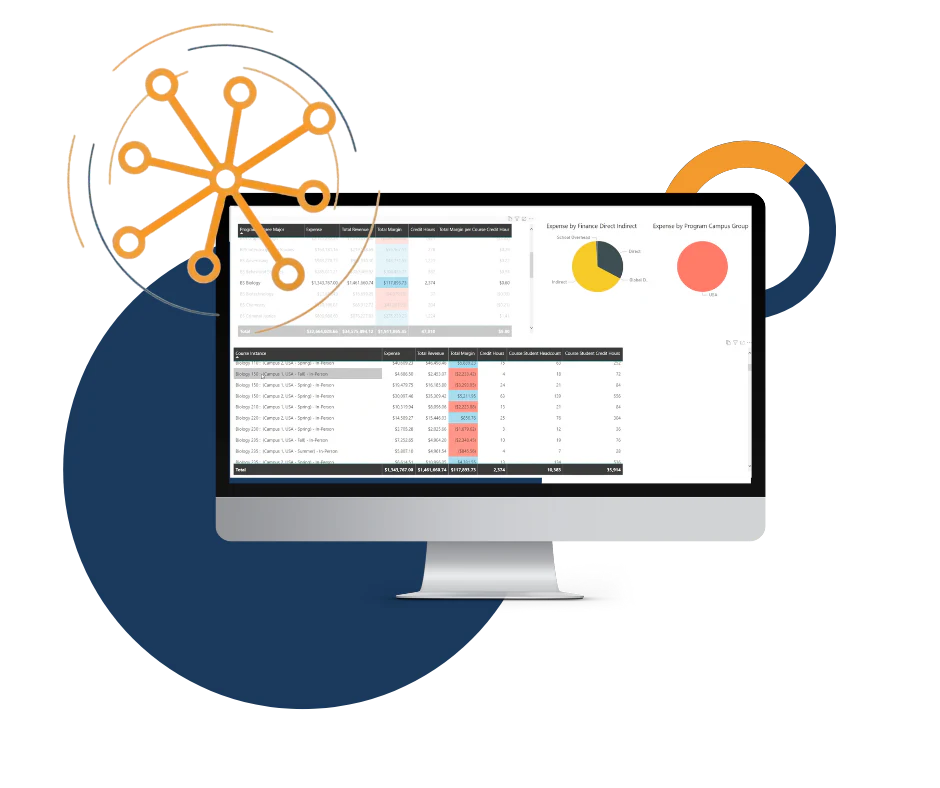
Pilbara Insights program and course margin report
What decision-support models are of interest to you?

Technology powered by Microsoft and Snowflake

Microsoft logoSnowflake logo