Higher Education Sector Intelligence with Pilbara Benchmarks

Benchmarking Built on Real Models — Not Opinions
Pilbara Sector Intelligence combines rigorous activity-based cost models with advanced benchmarking and AI-assisted insights to transform how universities measure and explain performance. Unlike survey-based benchmarks, our comparisons are built from raw institutional data, standardised across all participants for true like-for-like comparison — across disciplines, degree levels, and time.
- Benchmarking that is model-based, not survey-based.
- Comparable across institutions at discipline (FOE) + award level.
- Includes a broad set of financial + non-financial measures.
- Supported by an AI interface, Pilbara Intelligence, for explainable insights.
Rigorous methodology backed by academic collaboration
 We collaborate with the Centre for the Study of Higher Education who use our benchmarking data to provide sector specific analysis that’s contextually meaningful.
Established in 1968, the CSHE is a research and development centre dedicated to improving and utilising the best evidence-base for professional development and for influencing policy and practice in higher education.
This collaboration ensures that our intelligence is not simply data-rich, but context-rich — grounded in rigorous academic research and aligned with the real strategic challenges facing universities.
Download the latest research paper here.
The model methodologies that underpin the Benchmarks align with Professor William F Massy’s economic models described in his latest book “Resource Management for Colleges & Universities” and you can download an extract of his book here.
Built for Academic and Financial Leaders
Pilbara Benchmarks supports the conversations that matter most.
Budget Support
Identify cost per EFTSL metrics that can support baseline budget estimates.
Resource justification
Build evidence-based cases for investment, protection, growth or restructuring of disciplines and programs.
Strategic planning
Align resourcing with institutional priorities such as sustainability, equity, growth, or mission differentiation.
Performance and workload discussions
Support fair and transparent discussions grounded in comparable sector evidence rather than internal assumptions alone.
Cross-institution dialogue
Benchmark confidently against peers to highlight strengths, explain differences, and identify improvement opportunities.
Models Designed to Grow
")
Private Invitation: University Benchmark Preview
Evaluate real discipline-level benchmarks before committing to full participation.
We are inviting a limited group of university leaders to access a Private Preview of Pilbara’s Higher Education Benchmarks.
Preview includes
✔ 2-digit FOE benchmark
✔ 2021-2023
✔ Core measures
✔ Pilbara Intelligence access
Not included
✘ 4-digit FOE detail
✘ Full metrics
✘ 2024 data
No data submission required.
Limited invitations for university finance and academic leaders. This is not an automated system, each application is manually reviewed and approved, please allow up to two business days to receive your security code.
Example from the Full Benchmark Dataset

The Private Preview includes 2021–2023 data at 2-digit FoE level but uses the same structure and methodology.
Pilbara Intelligence
Pilbara Benchmarks incorporates Pilbara Intelligence; an AI solution designed specifically for higher education management. Traditional benchmarking are static tables. Pilbara Intelligence is an interactive insight engine. Ask why our cost per EFTSL is higher and get structured analysis, not just a number.
Two powerful components working together
SQL Agent
Interrogates the underlying database directly, ensuring calculations are accurate, traceable, and trustworthy.
Large Language Model Interface
Allows leaders to explore benchmarks using natural language. Ask questions conversationally and receive structured, evidence-based insights.
Pilbara Intelligence is a support tool and not a substitute for strategic judgment.
Powered by:

Limited invitations for university finance and academic leaders. This is not an automated system, each application is manually reviewed and approved, please allow up to two business days to receive your security code.


“We understand what our programs cost, but what should they cost?”
The Question That Started It All
While working with the LH Martin Institute at the University of Melbourne, a senior professor asked us the question above, which was deceptively simple, but one we couldn’t answer.
Answering that required something higher education has always struggled with: true, like-for-like comparison across institutions.
Programs are structured differently. Data sits in silos. Cross-subsidies blur the picture. Subjects feed multiple programs. Very little lines up neatly.
For over 20 years, Pilbara Group has solved the first problem: accurately calculating the full cost of teaching.
Pilbara Benchmarks solves the next one: comparing those costs meaningfully across institutions.

What Makes Pilbara Benchmarks Different
This is activity-based, discipline-level, evidence-driven benchmarking built on a consistent methodology across institutions.
Your institution compared against real peers using:
-
21 core financial and non-financial measures
-
2-Digit and 4-Digit Fields of Education
-
Bachelor, Postgraduate and Sub-Bachelor programs
-
Academic, professional and non-salary cost mix
-
Efficiency and workload indicators
-
Four years of multi-institution benchmark data
Behind the scenes, we have curated over 100 million validated records from an original dataset of more than 9 billion rows, using consistent Activity-Based Costing models.
This ensures comparisons are meaningful, defensible, and decision-ready.
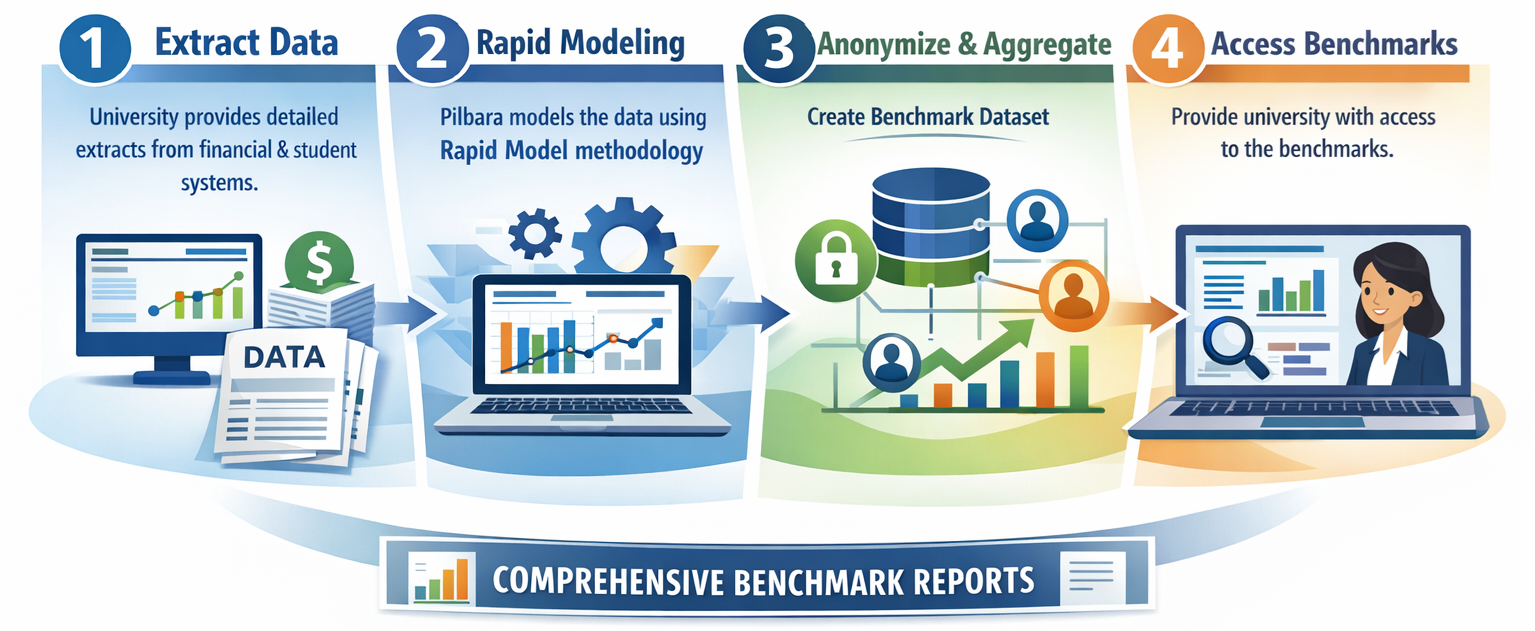
The Process
")
Move From “How Do We Compare?” to “Why?”
Traditional benchmarking tells you where you sit overall.
Pilbara Benchmarks helps you understand why.
Leaders can explore questions such as:
- Why is our cost per EFTSL higher in Biology—is it driven by staffing levels, salary costs, or non-salary expenses?
- Which disciplines should we grow, sustain, or review based on their cost-efficiency profile, resource intensity, and alignment with our delivery model?
- Are our FTE-to-EFTSL ratios aligned with our actual teaching delivery patterns and workload, or do we have structural inefficiencies?
- If we have similar cost per EFTSL to sector in Engineering, do we achieve this through lower staffing, lower salaries, or operational efficiency?
This moves benchmarking from static reporting to strategic insight.

Sample CFO Report
We have included a sample CFO report generated by Pilbara Intelligence using Insights University demo data, compared against real benchmark data available for download.
This demonstrates:
-
How insights are structured
-
The tone suitable for executive reporting
-
The level of diagnostic explanation
The objective with this type of AI assisted analysis is not to generate a final polished report, rather it allows multiple different scenarios and reports to be created very quickly, in minutes, and grounded in real numbers. Then you can select the best options for more in-depth analysis and the final development of the completed document / analysis.
Integrated with Microsoft Excel — Intelligence Where You Work
We recognise that for most higher education finance and planning teams, Microsoft Excel remains the primary analytical environment. Financial models, forecasts, faculty planning, scenario analysis, and board reporting often begin — and end — in Excel.
That is why both our Higher Education Sector Intelligence dataset and Pilbara Intelligence AI are fully integrated with Microsoft Excel.
Our objective is simple:
Deliver intelligence where you already work.
Excel integration – day-to-day analytics
Benchmarks Portal – Strategic Management

More Than Benchmarks. A Platform for Collaboration.
The benchmark dataset is powerful. The real impact comes from what it enables.
Pilbara Benchmarks creates a shared evidence base that supports cross-institution learning and collaboration, helping universities improve quality, sustainability and public value.
At a time of increasing financial pressure and complexity, shared insight is no longer optional. It is essential.
Limited invitations for university finance and academic leaders. This is not an automated system, each application is manually reviewed and approved, please allow up to two business days to receive your security code.
Discuss Full Benchmarks
If you would prefer to discuss the full benchmarks rather than request access to the private preview, please complete the form below.
Pilbara is trusted by leading institutions around the world


")

Enterprise-Level Data Security and Governance
We understand the sensitivity of institutional data.
Pilbara Group has achieved SOC 2 Type II compliance under AICPA SSAE 18 standards. This provides independent, third-party validation of our enterprise-level security controls.
 We are also implementing robust AI governance frameworks and guardrails to ensure outputs are transparent, explainable and responsible.
Human oversight remains central. Pilbara Intelligence supports decision makers, it does not replace them.